Dataplay3 Feature Introduction
demo
or youku
workflow
Following diagram shows the basic workflow of dataplay3:
- prepare your data as csv, import it as dataset
- you can run query to transform your dataset into a new result
- you can visualize your dataset or query result using grammar drive data visualiztion or typed chart
- you can use dataset to build a prediction model, where the target could be a numeric value, a ctagorical value, or time serials related prediction.
- you can use prediction model to predict using a new dataset
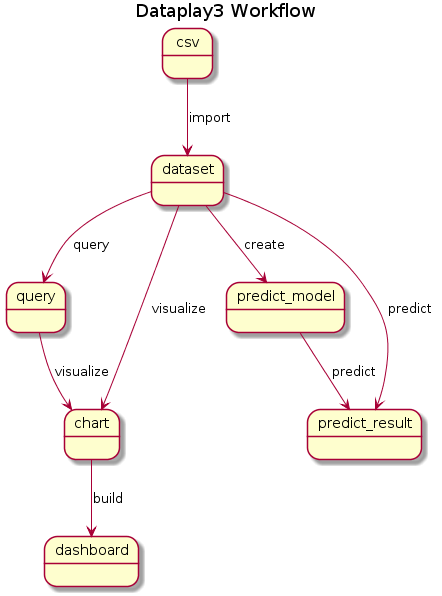
@startuml

title Dataplay3 Workflow

state csv
state dataset
state query
state chart

csv --> dataset : import
dataset --> query : query
dataset --> chart : visualize
query --> chart : visualize
chart --> dashboard : build
dataset --> predict_model : create
dataset --> predict_result : predict
predict_model --> predict_result : predict

@enduml
manage dataset
The first thing you need to do is to have a dateset, with page dataset -> import data you can import a csv file or using those sample dataset provided by dataplay3.
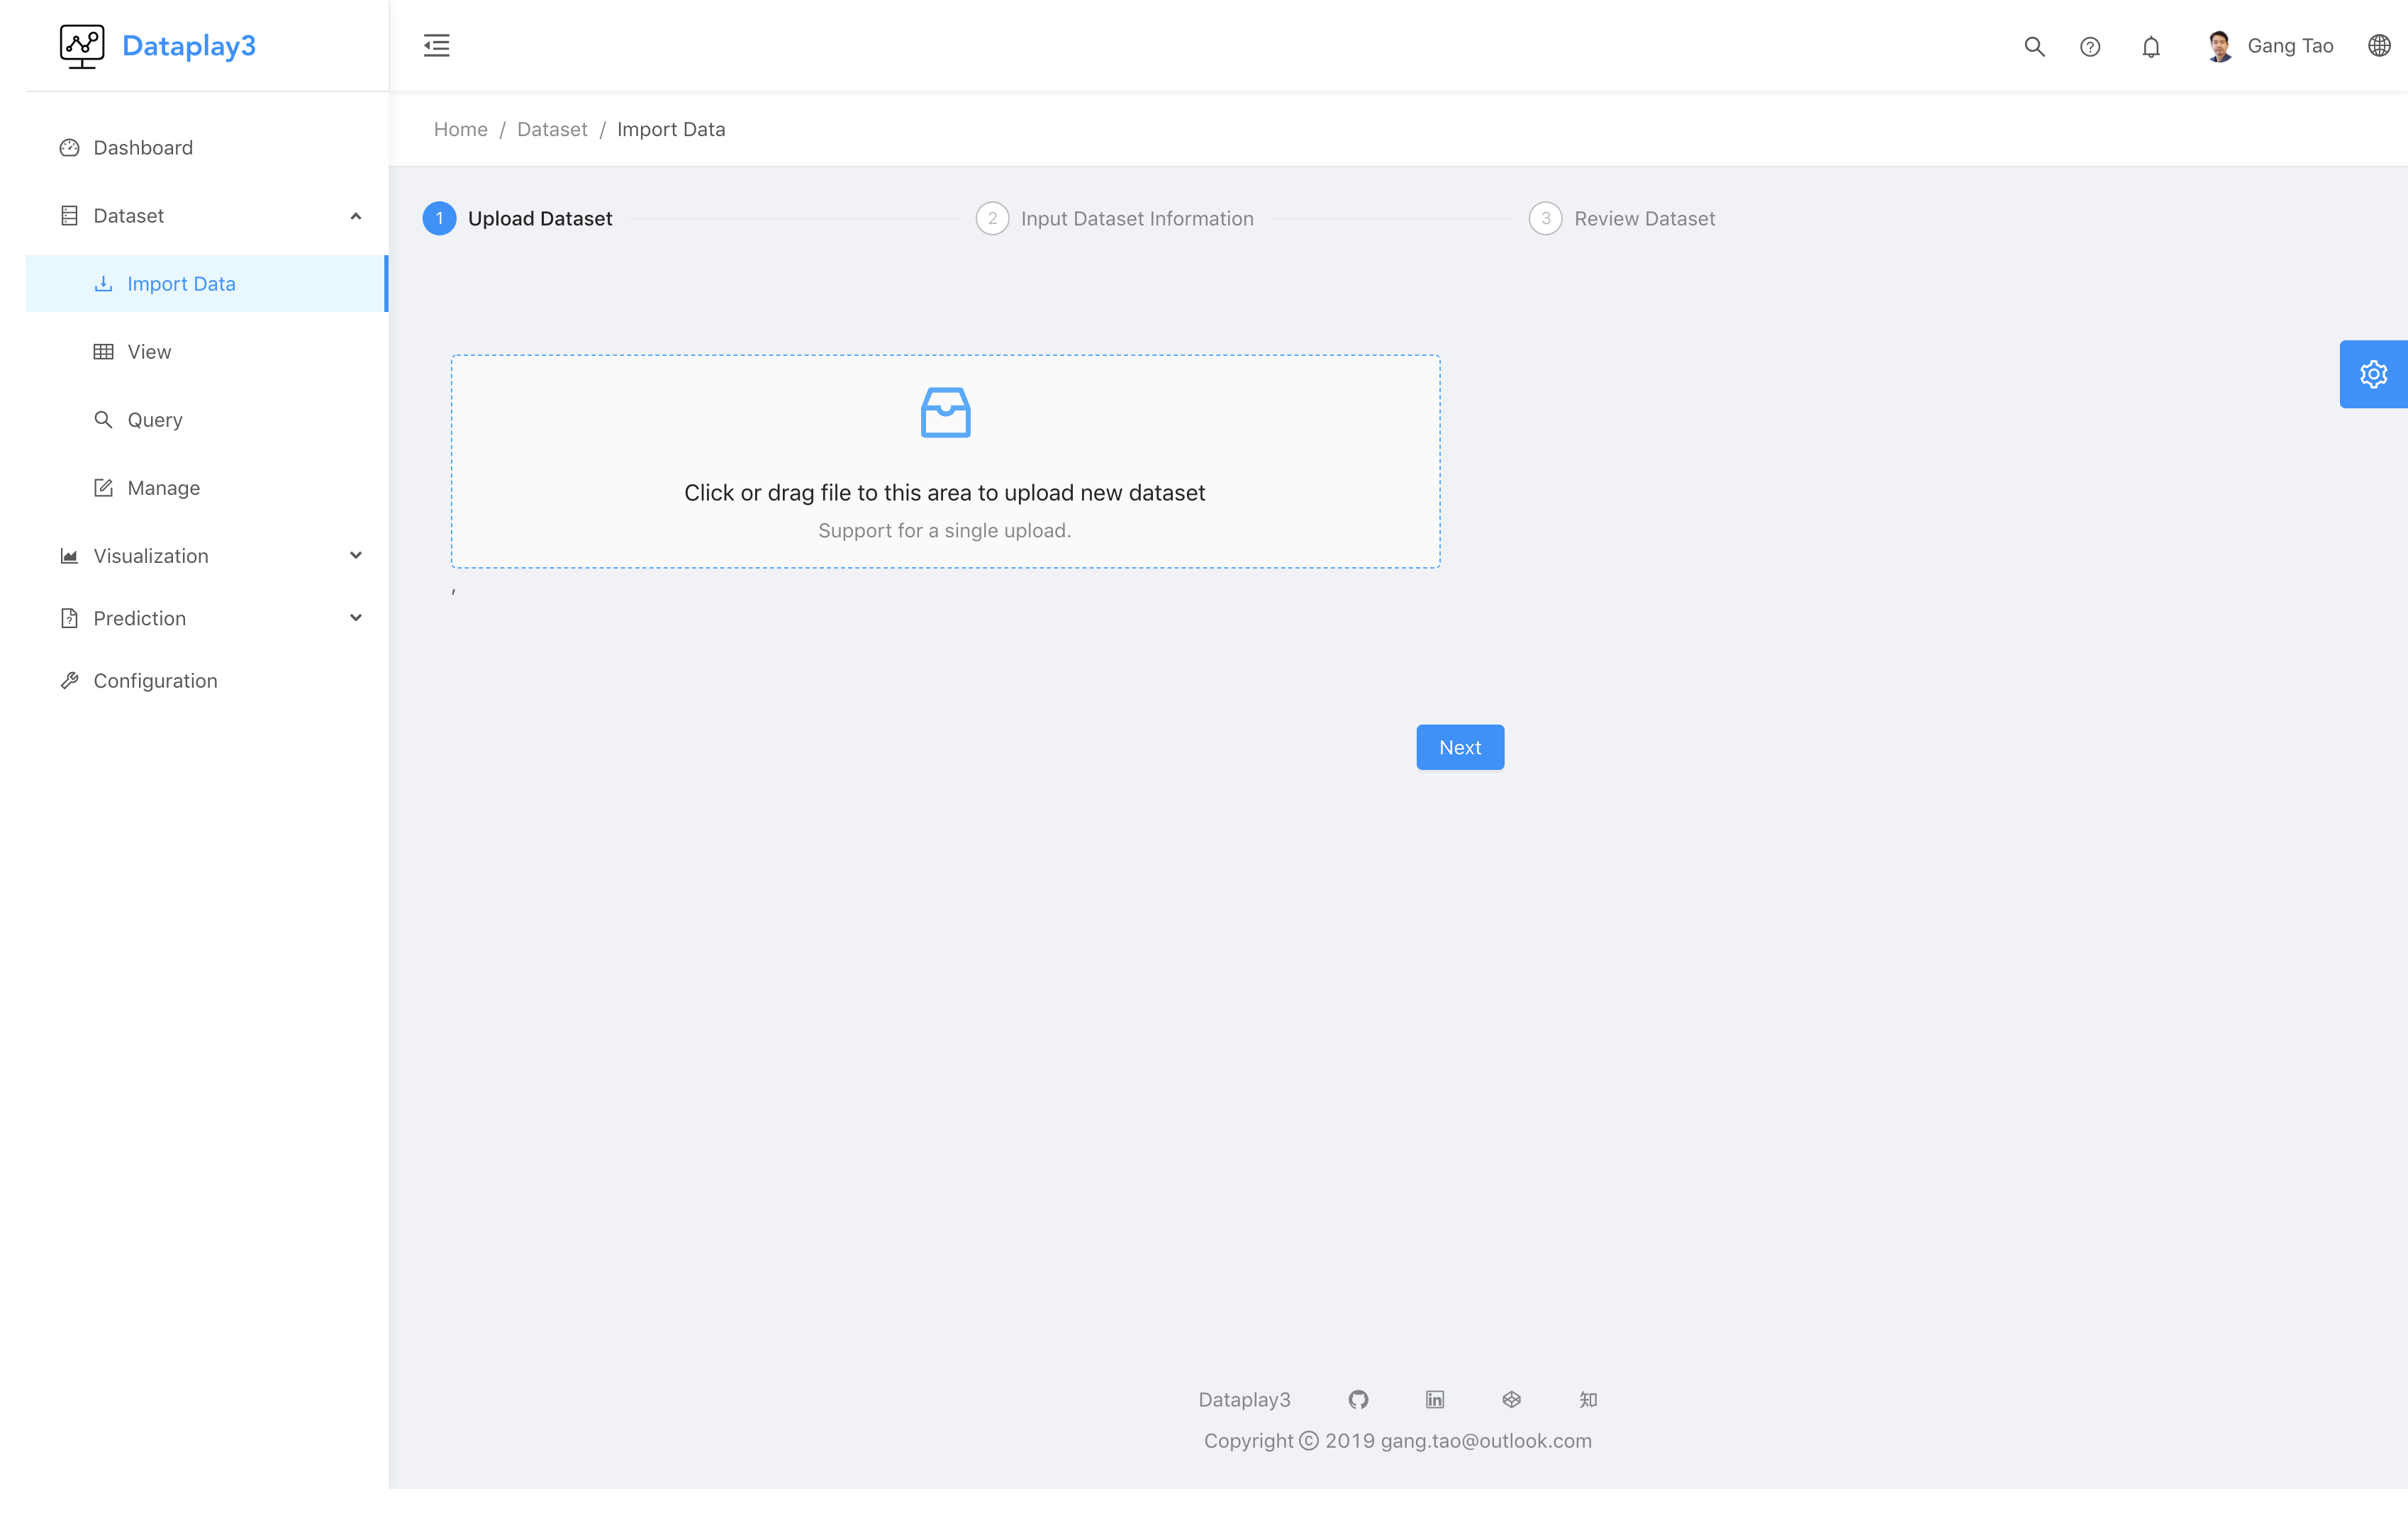
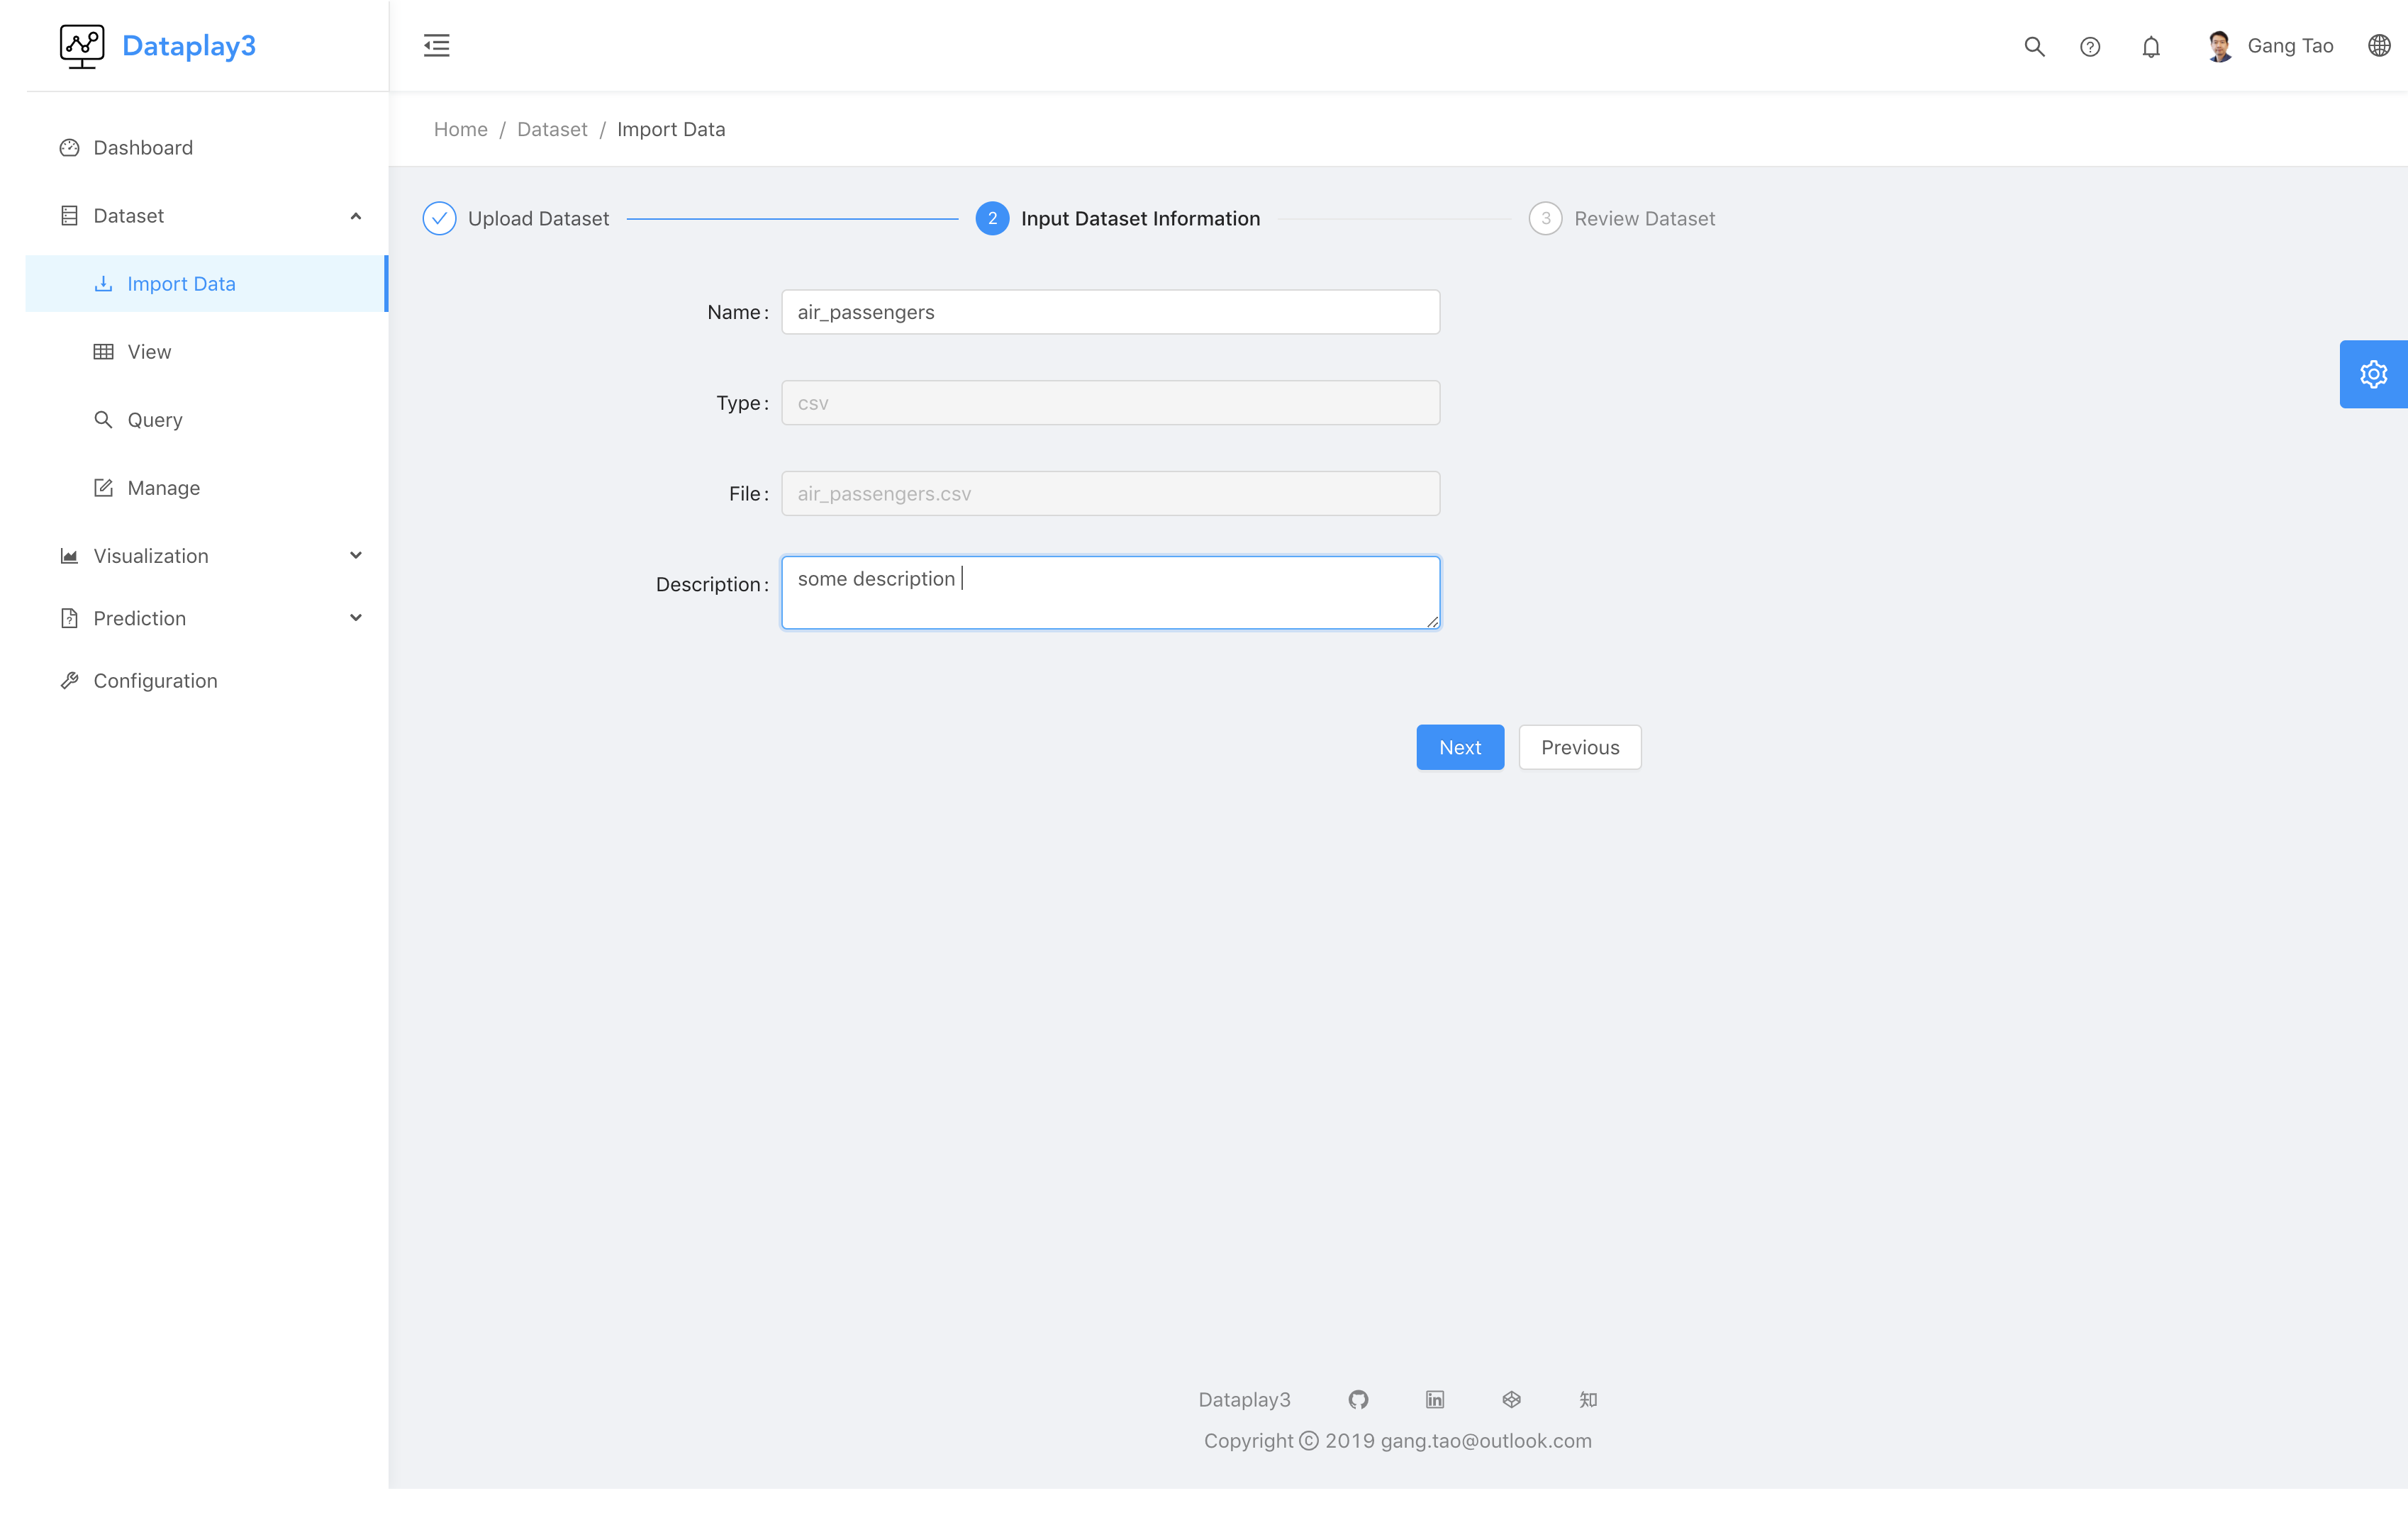
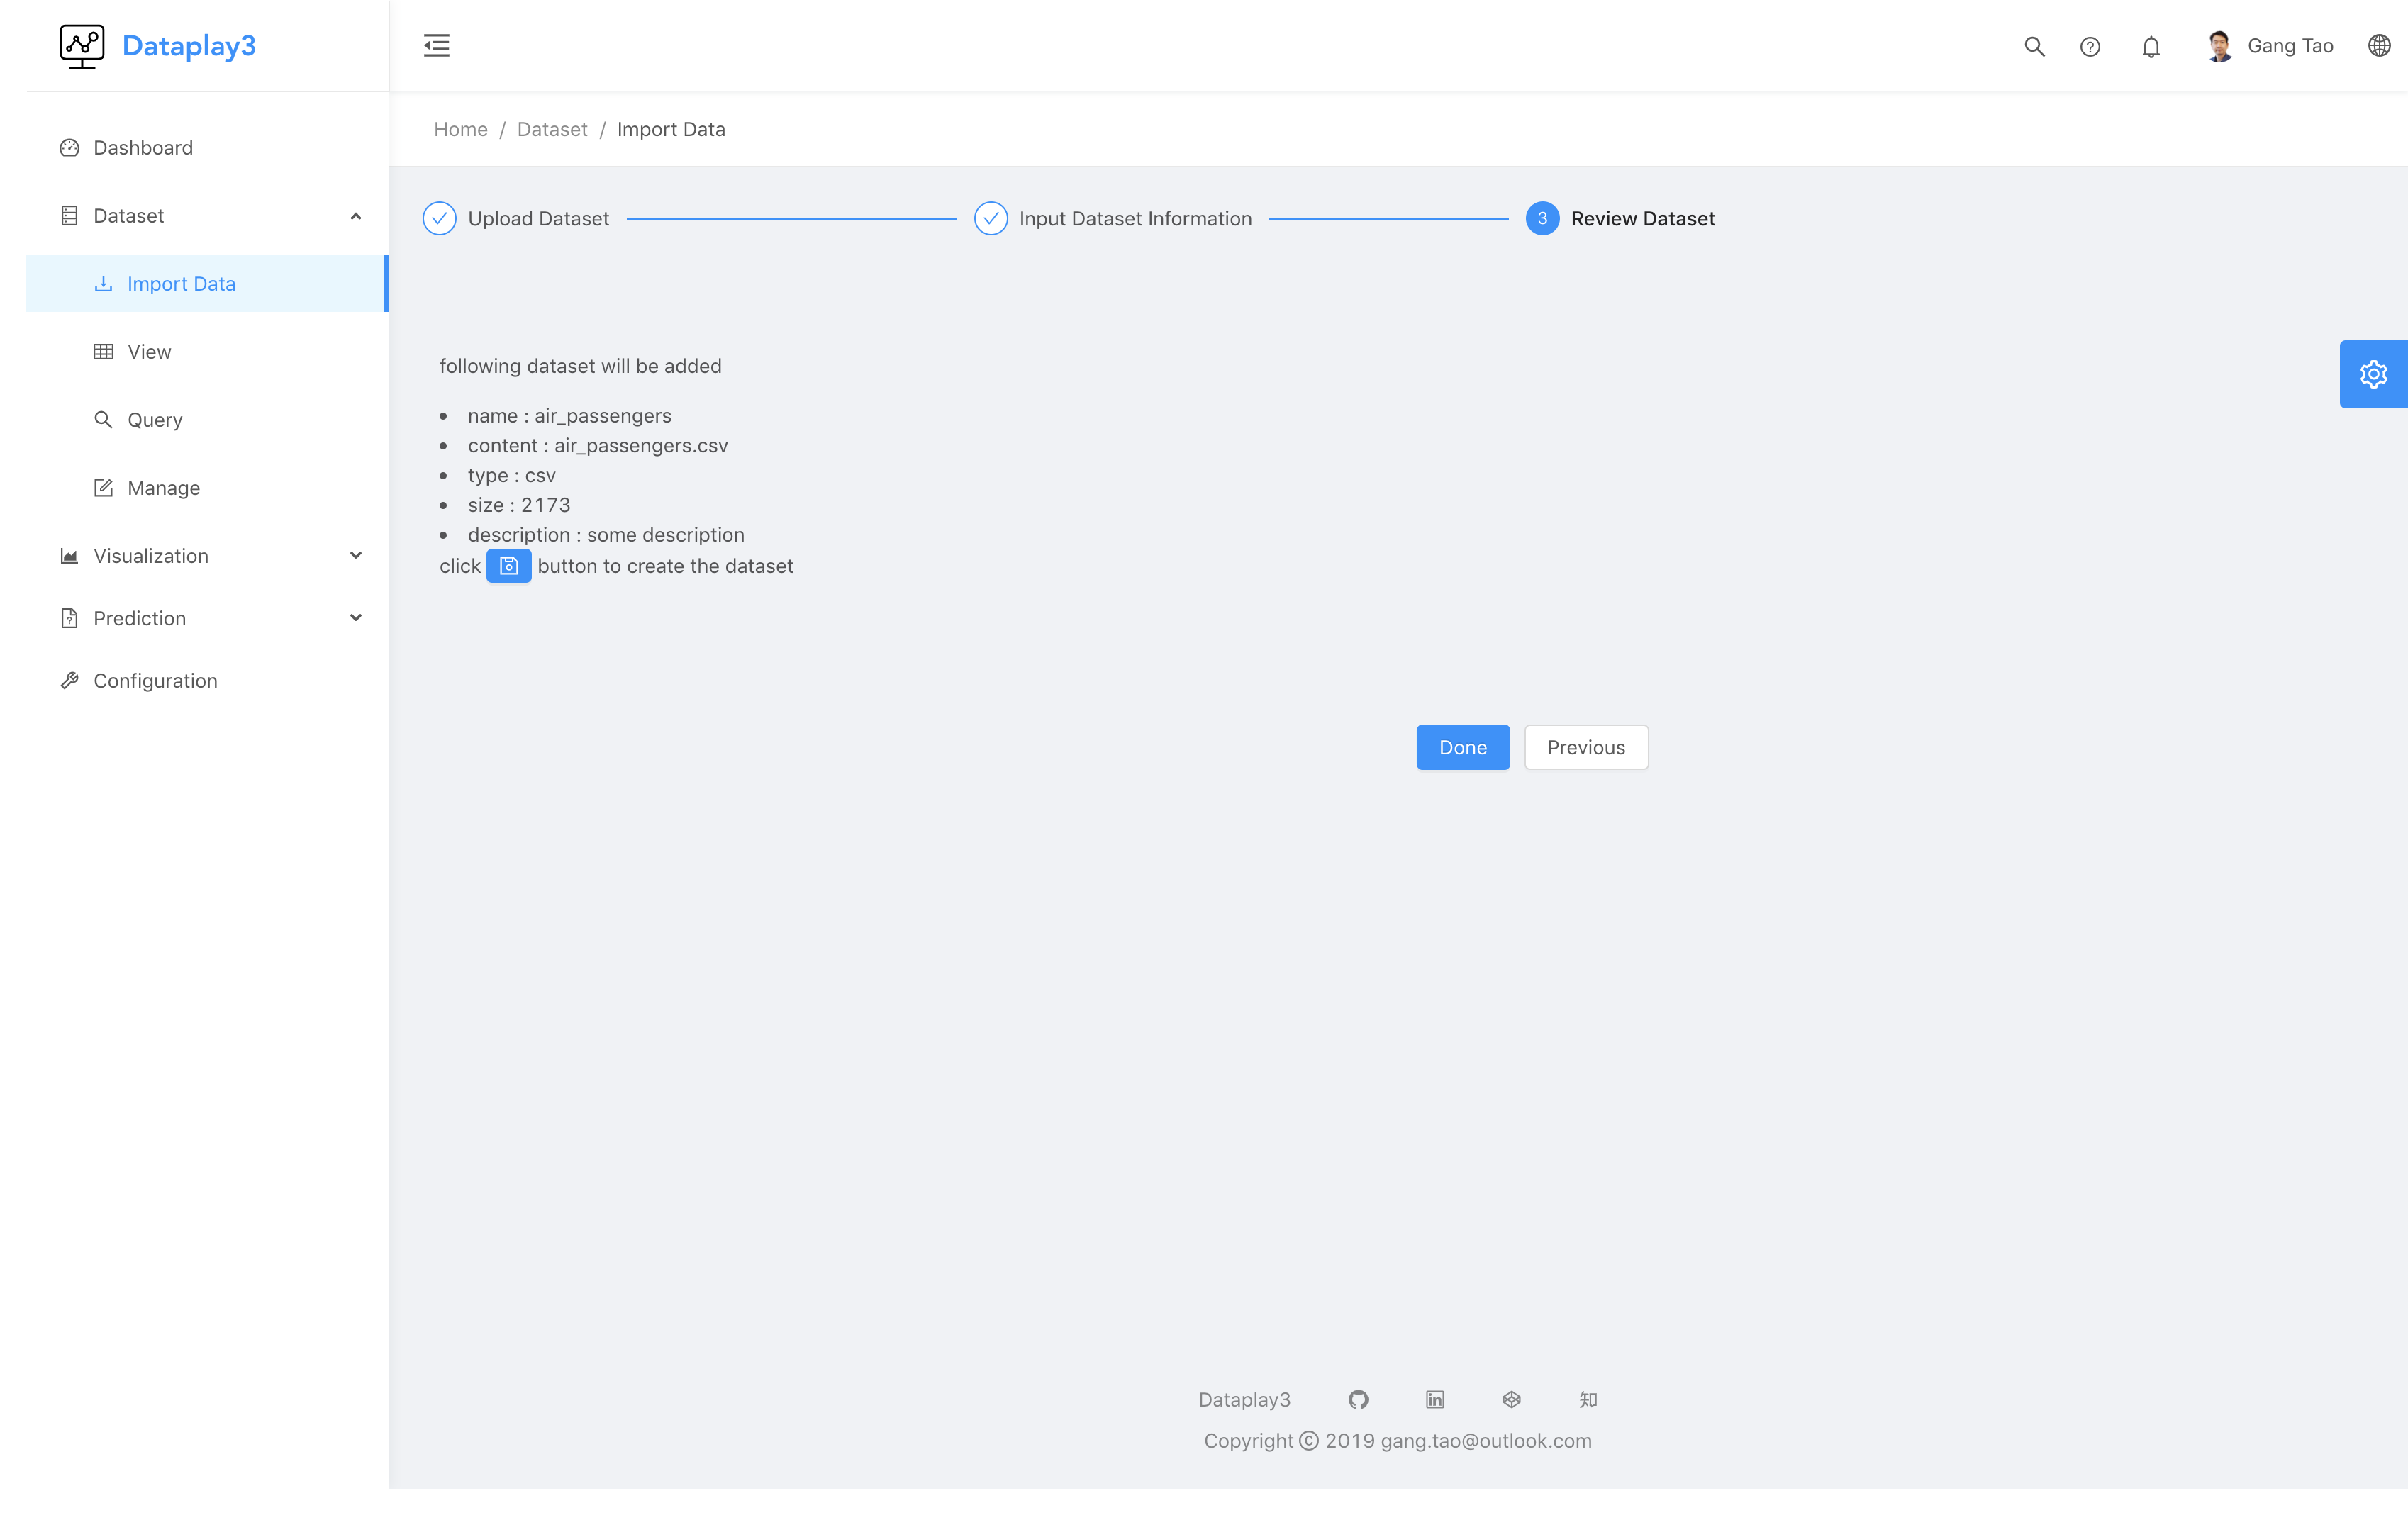
Do not forget to click save button to save the dataset in the final step.
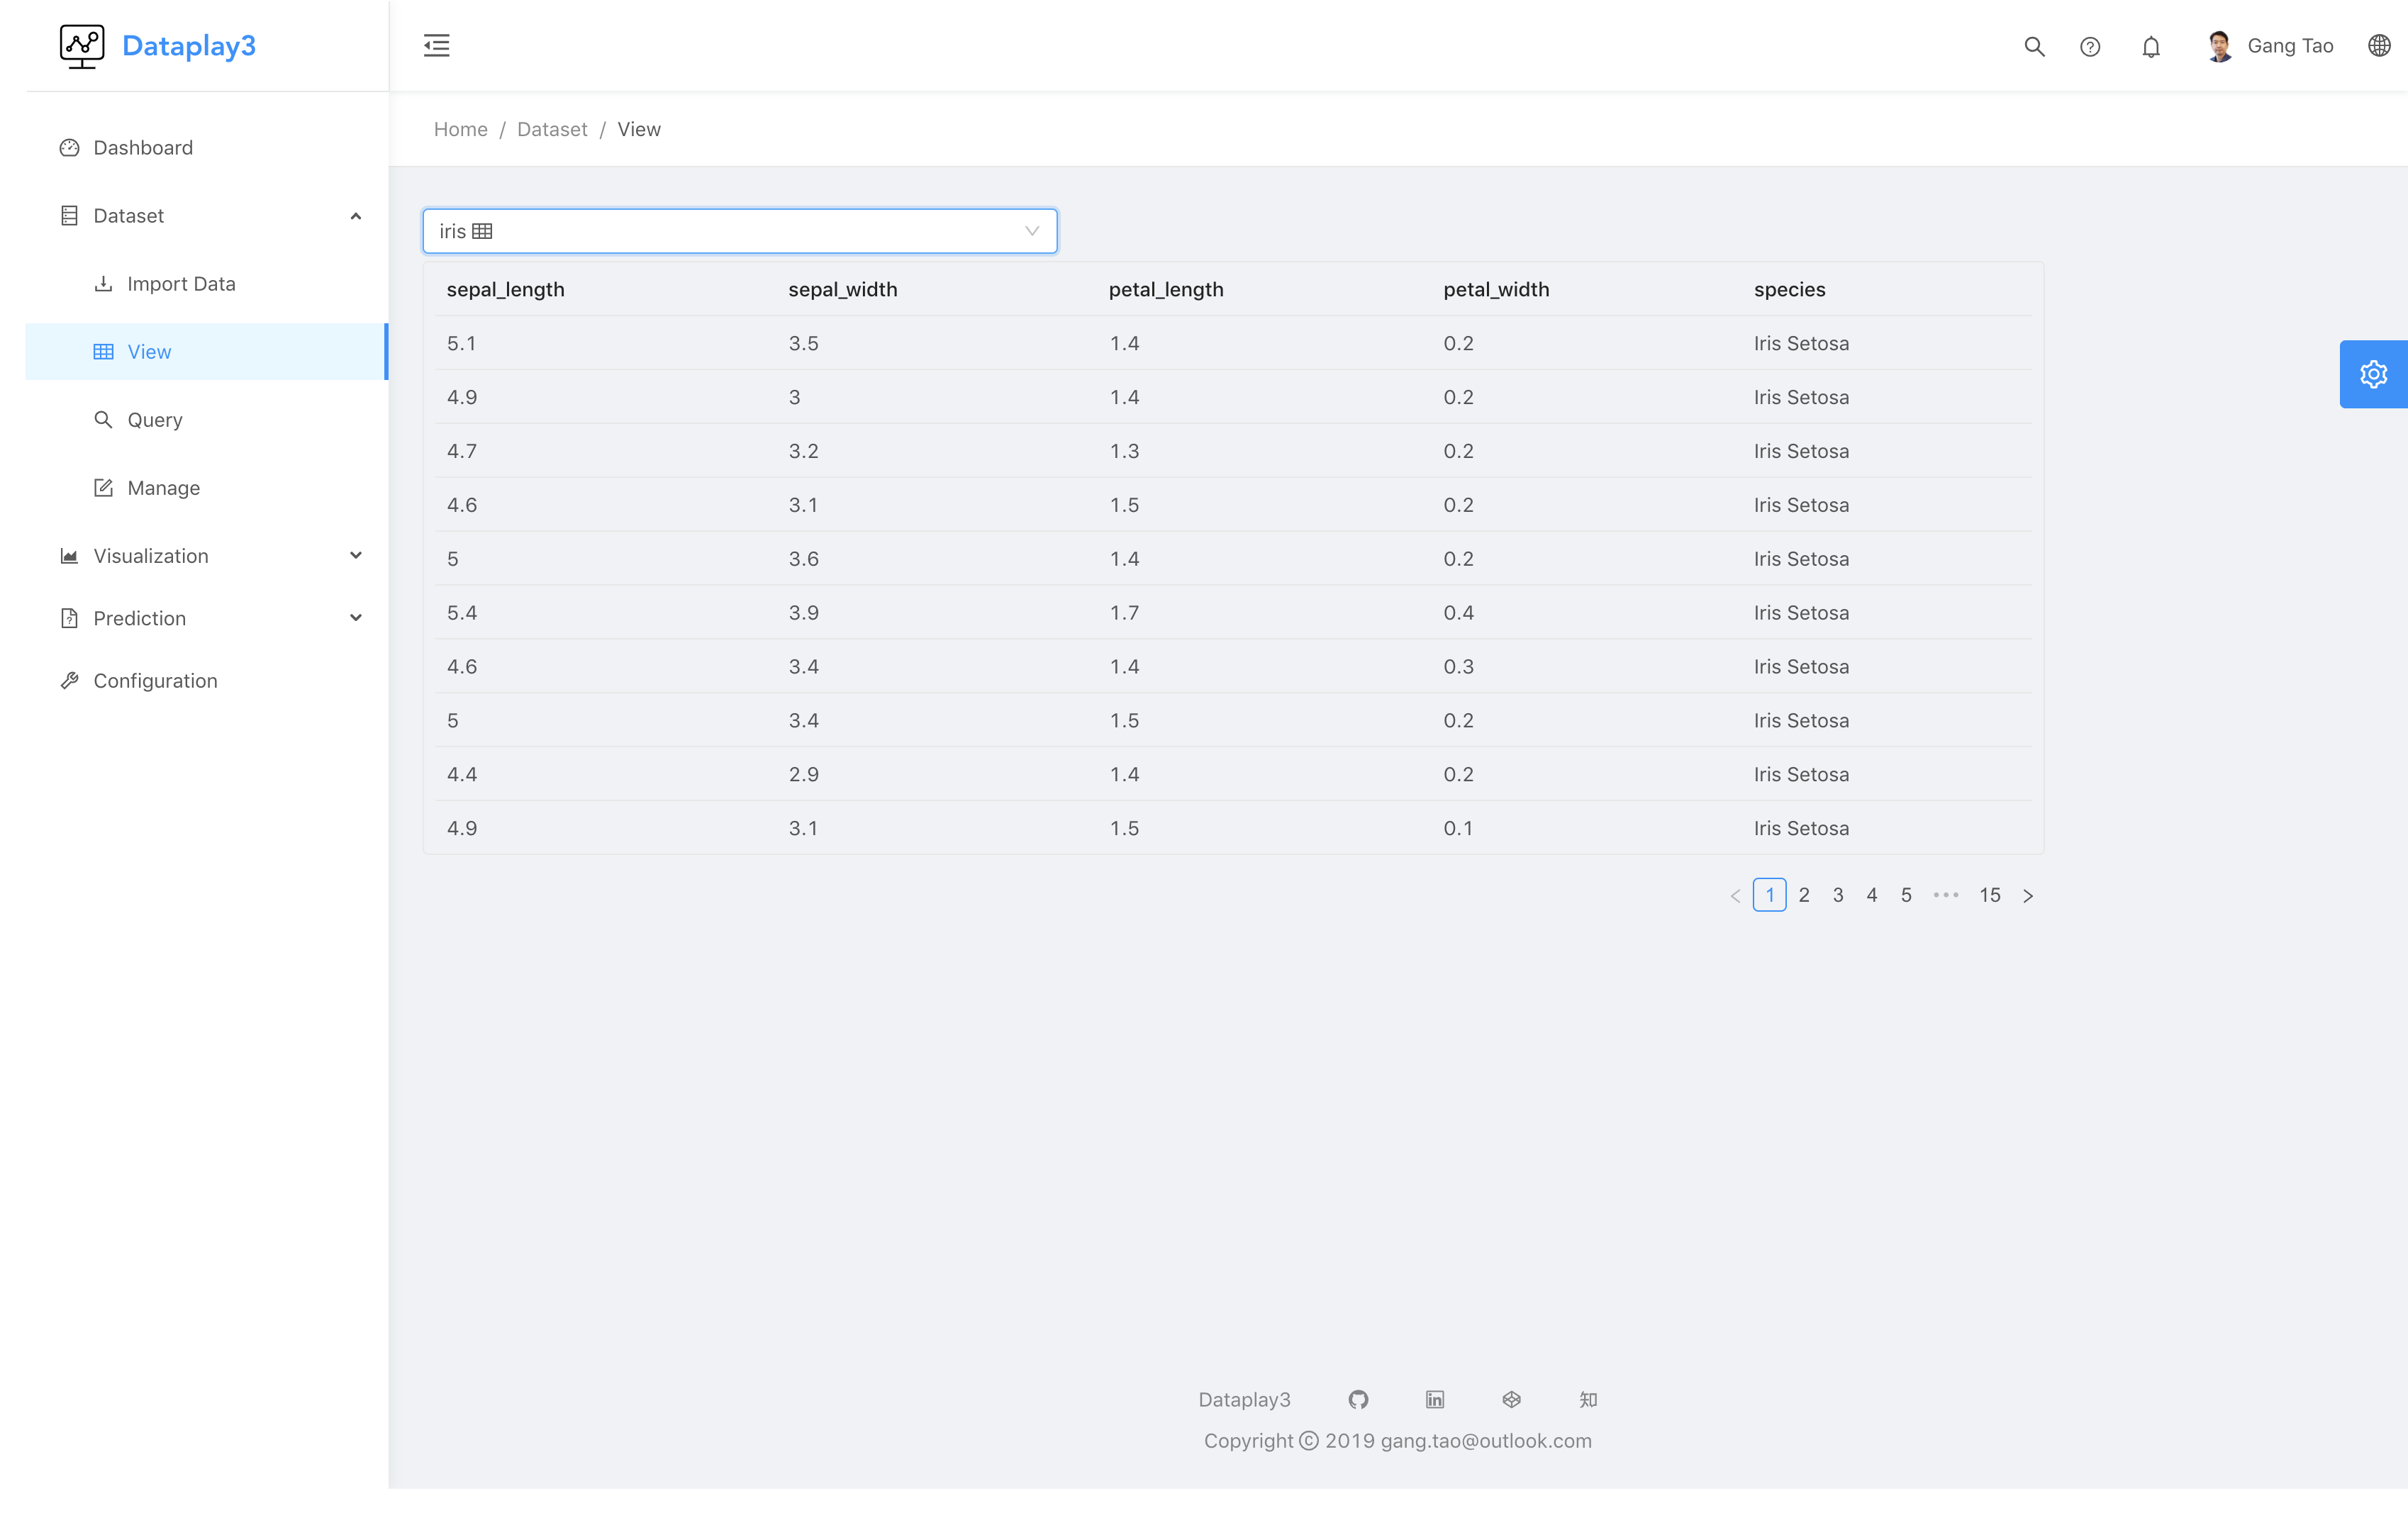
With page dataset -> view, you can view your current dataset
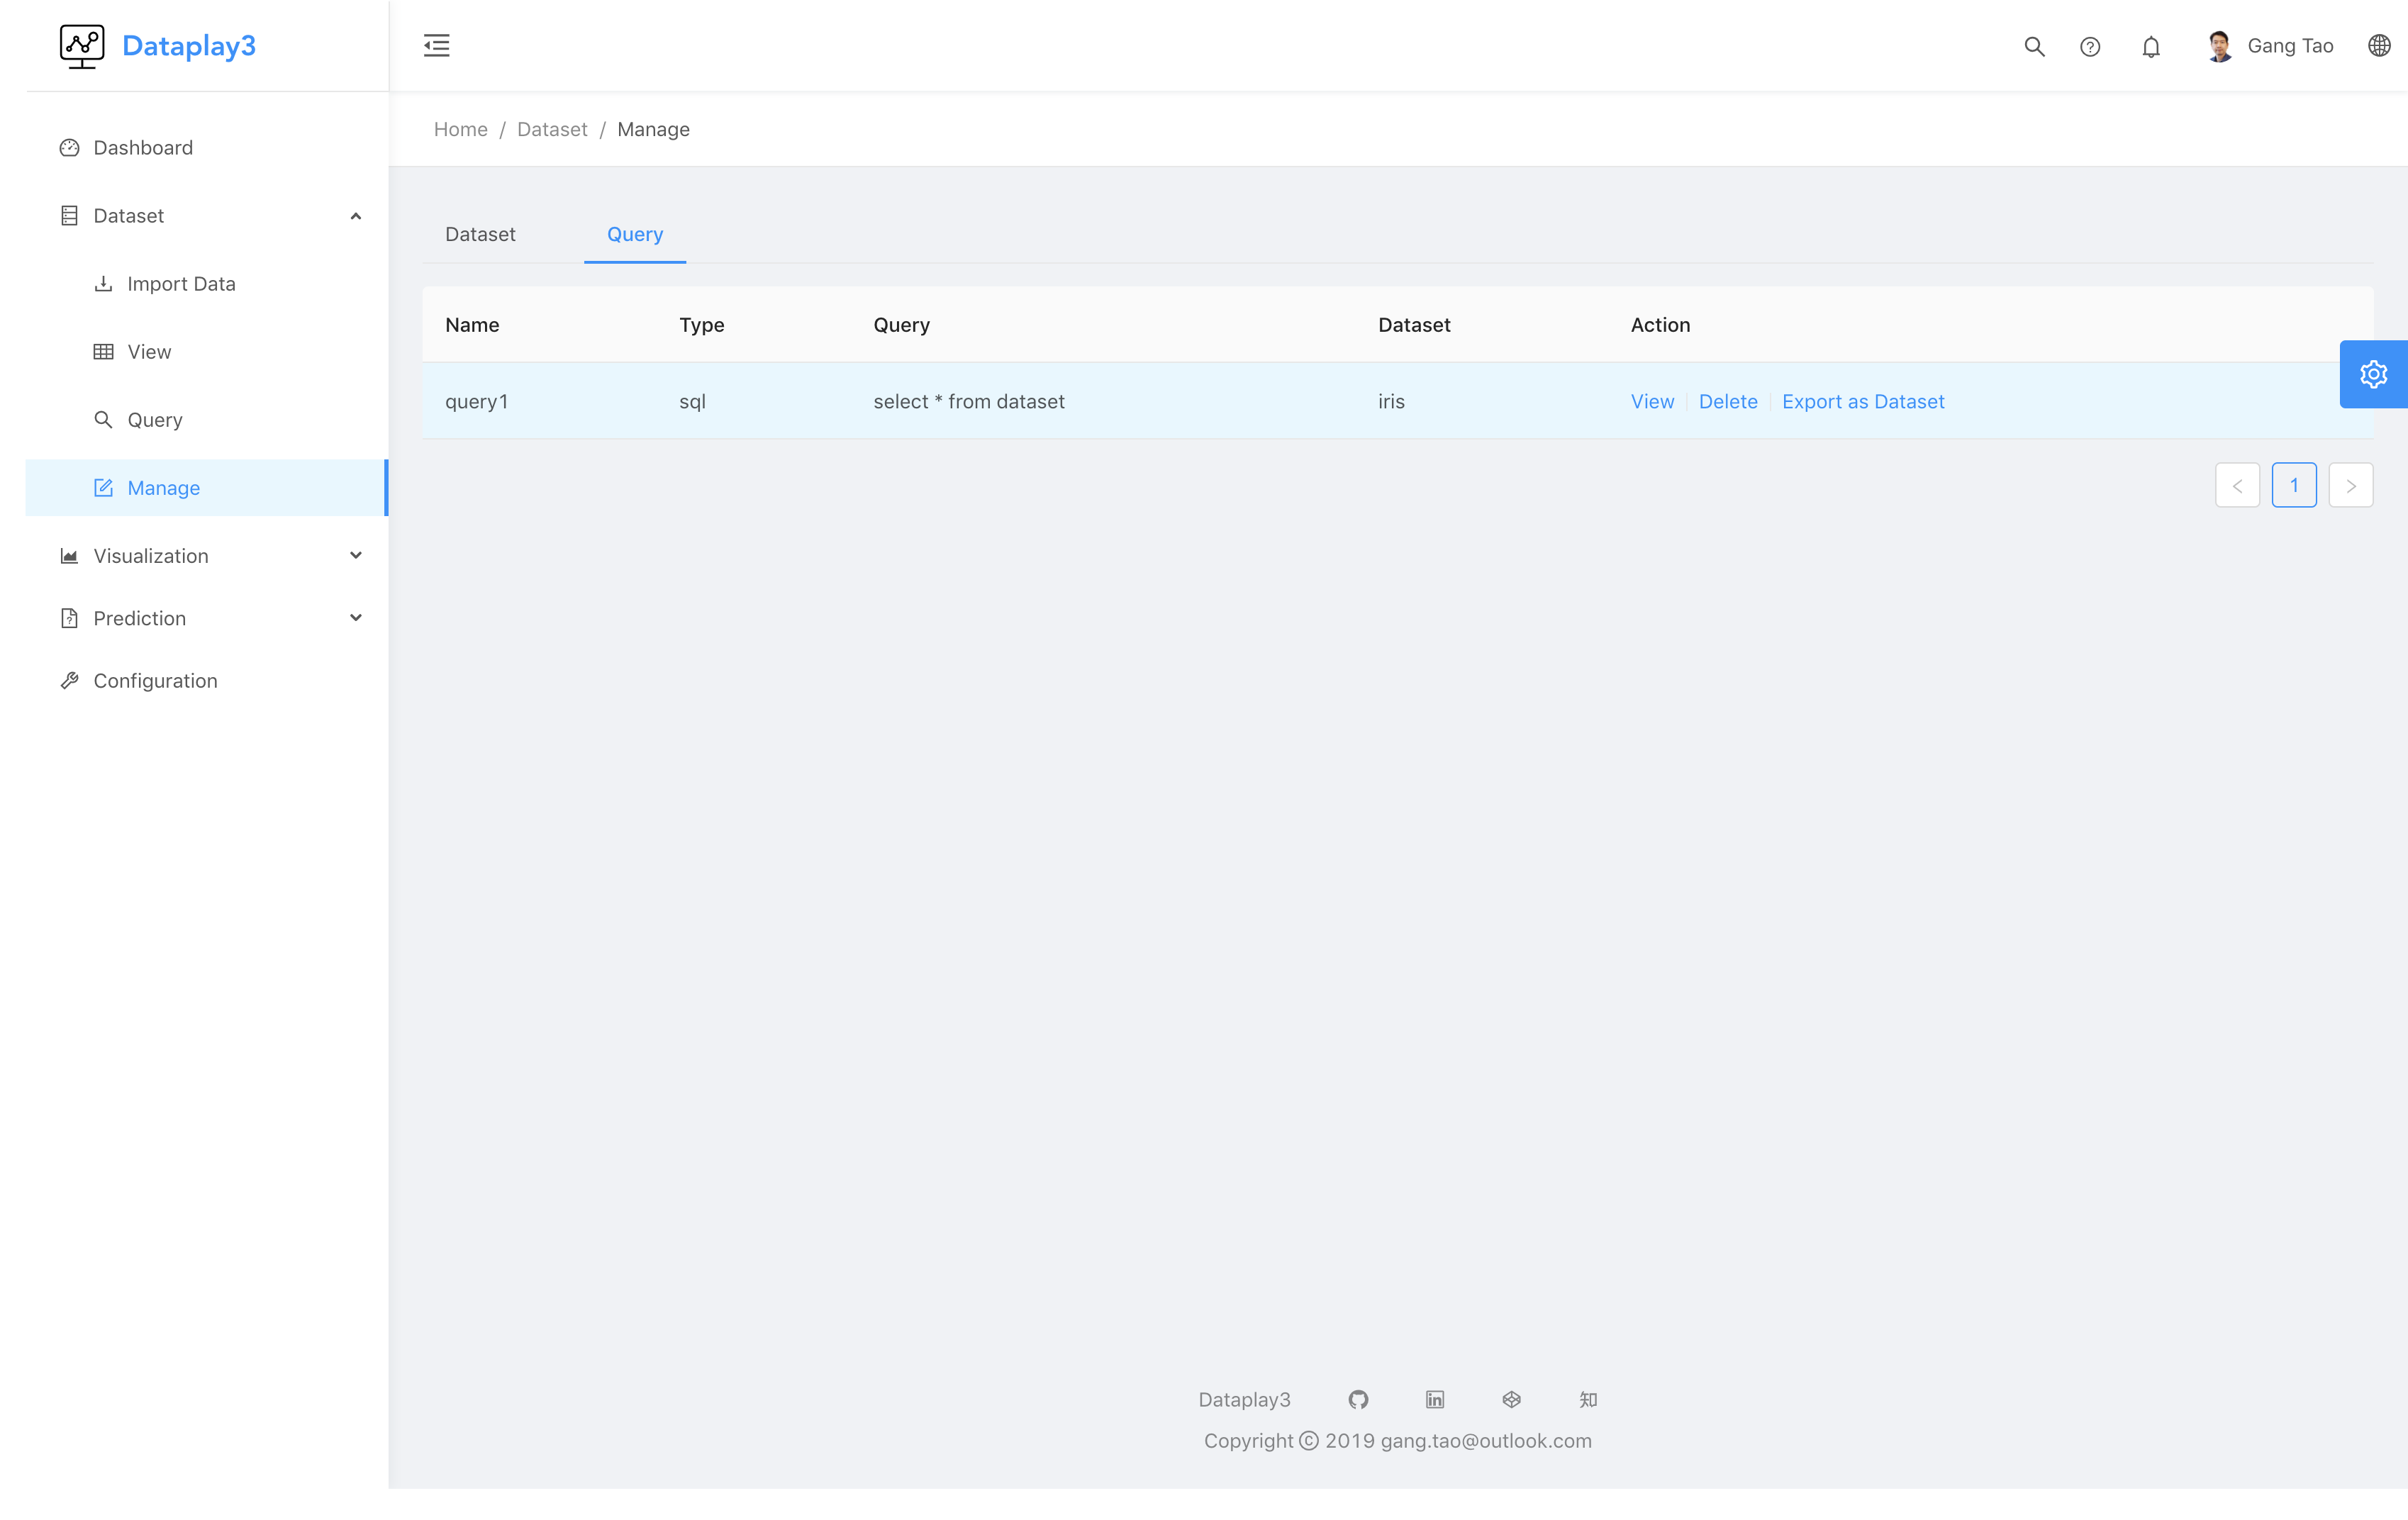
With page dataset -> query, you can run a query to query dataset and save the result for future visualization
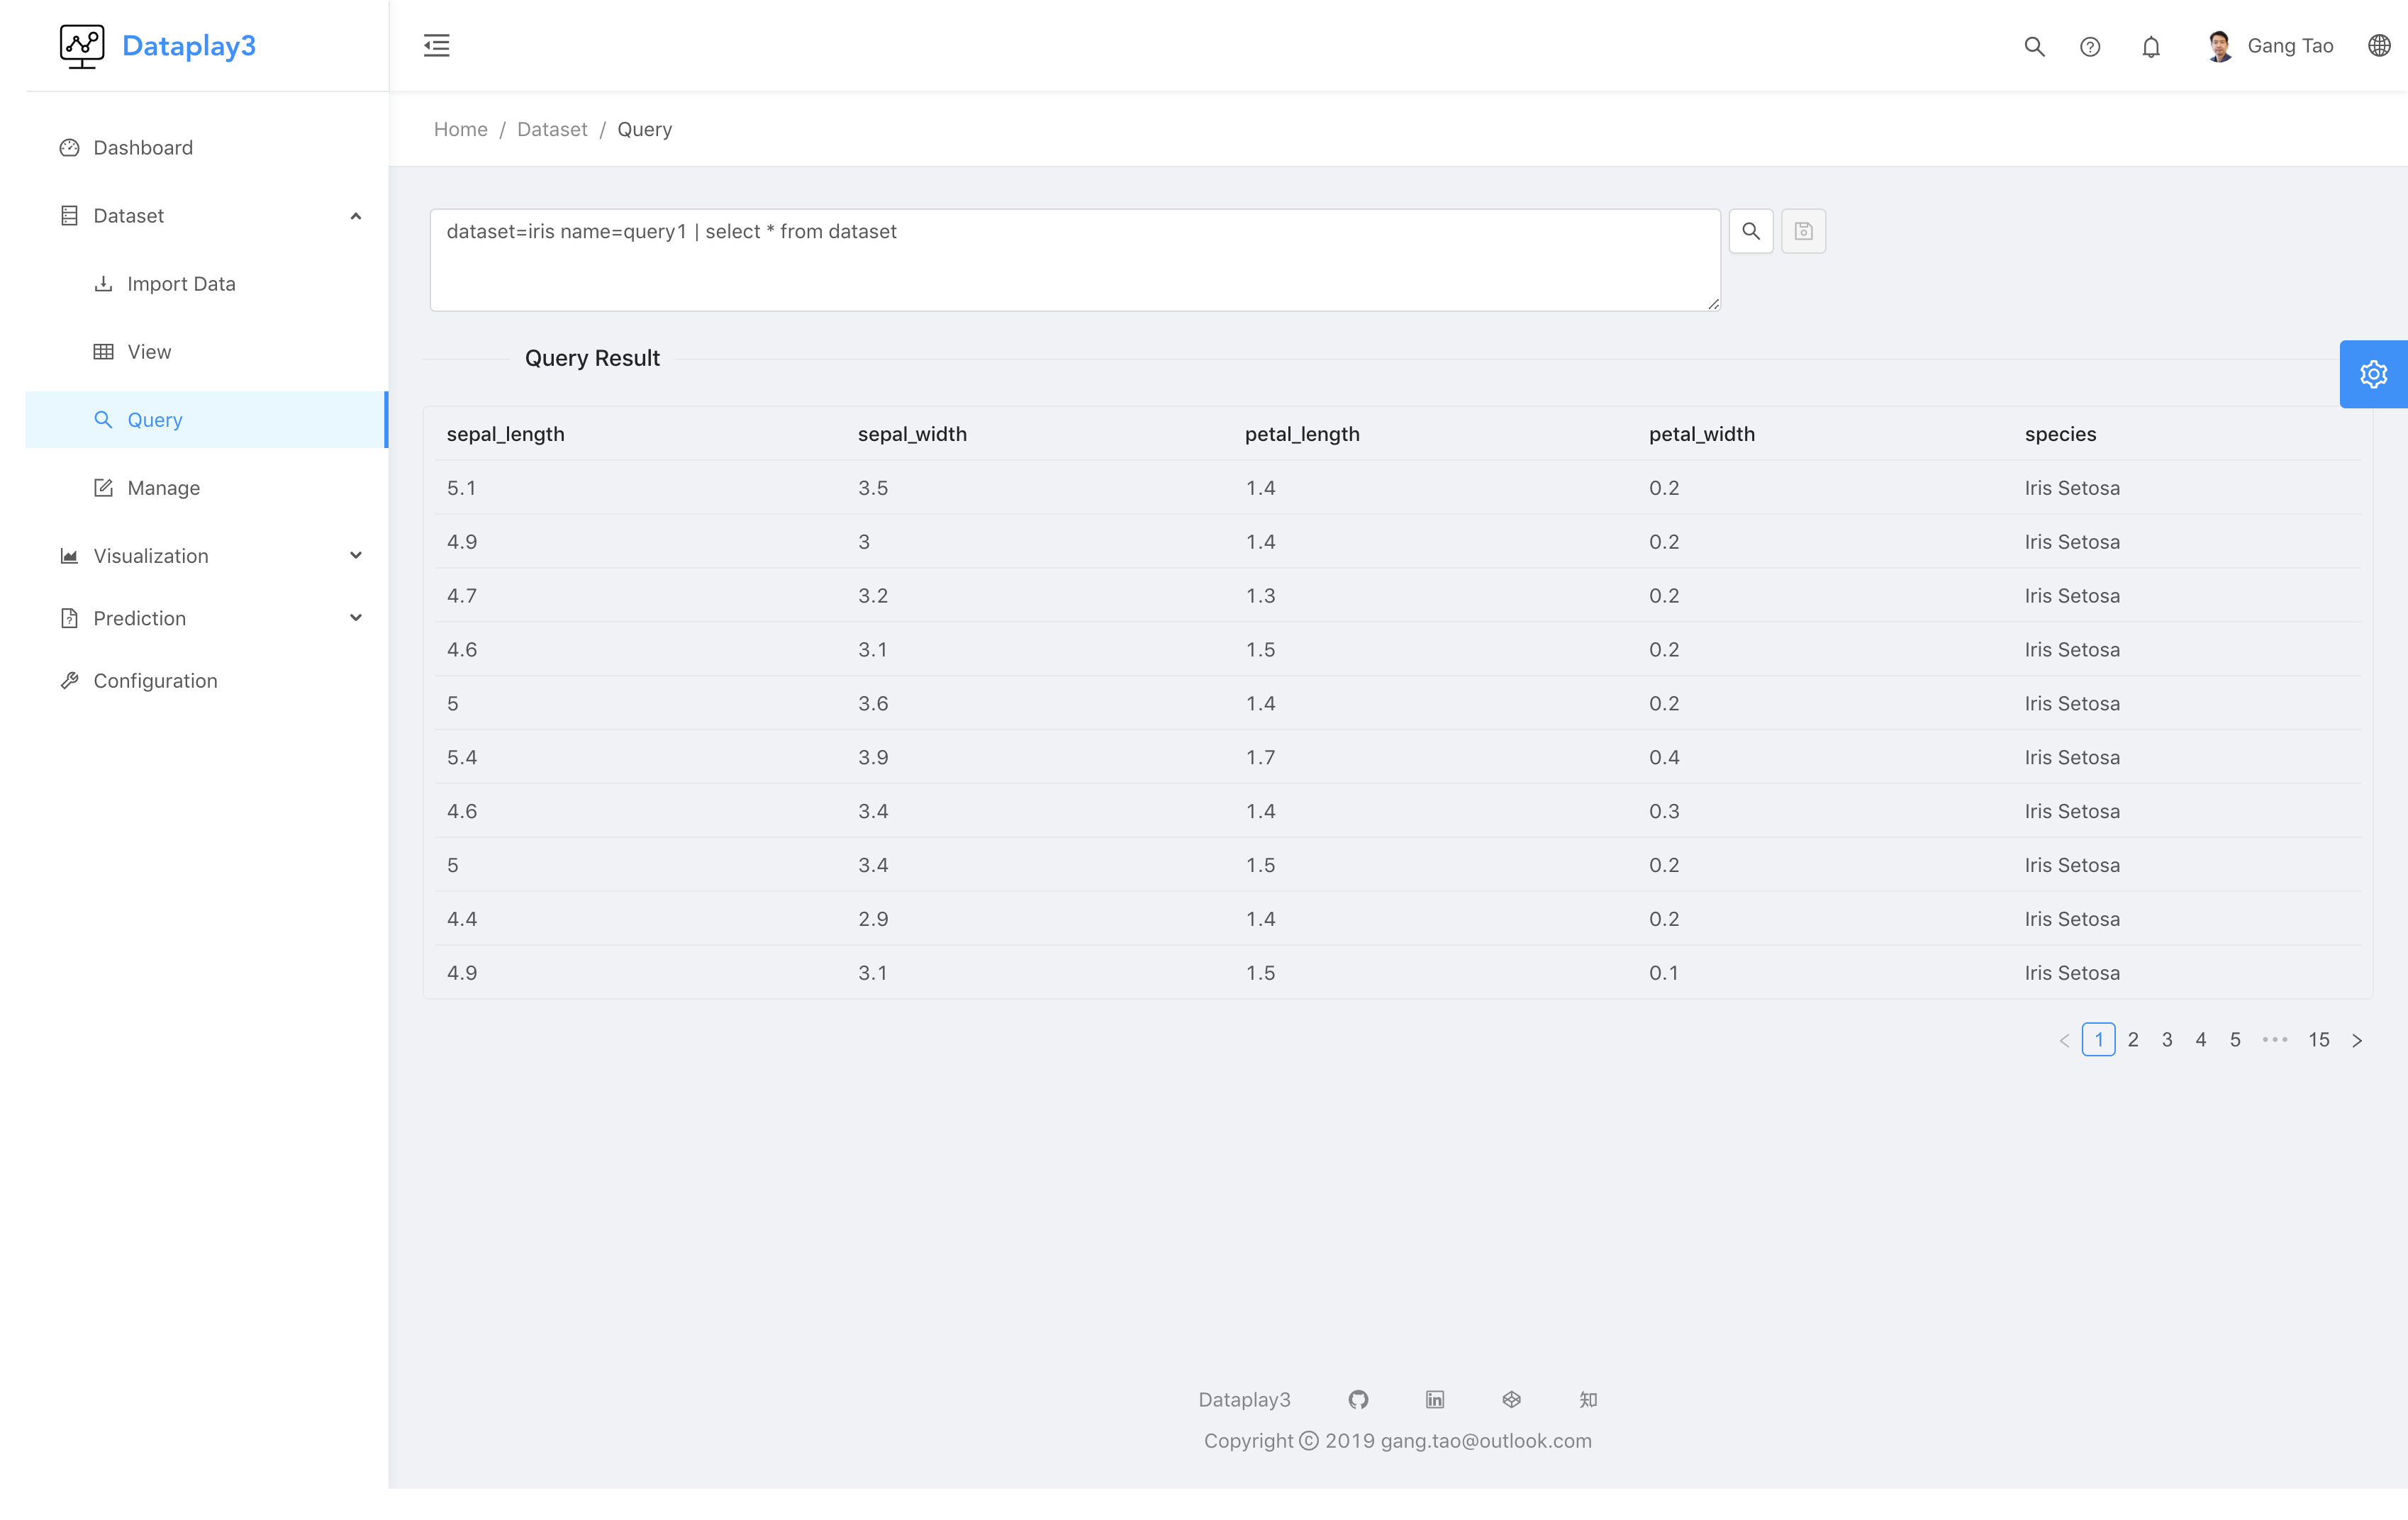
the query should be in following grammer:
dataset=<dataset_name> type=(sql|query) name=<query_name> | query
Two types of query is now supported:
- pandas dataset query
- sql query , now a simple sql query is supported, can only support one dataset with
from datasetas condition.
Here are some query samples:
dataset=iris | select sum(sepal_length),sum(sepal_width), species from dataset group by species
dataset=nasdaq name=query1 type=sql | select * from dataset ORDER BY Date Desc Limit 1000
dataset=iris type=query | species == "Iris Setosa"
Click save dataset query button to save the query result. dataset is required, type default to sql and name is required when you want to save the query result.
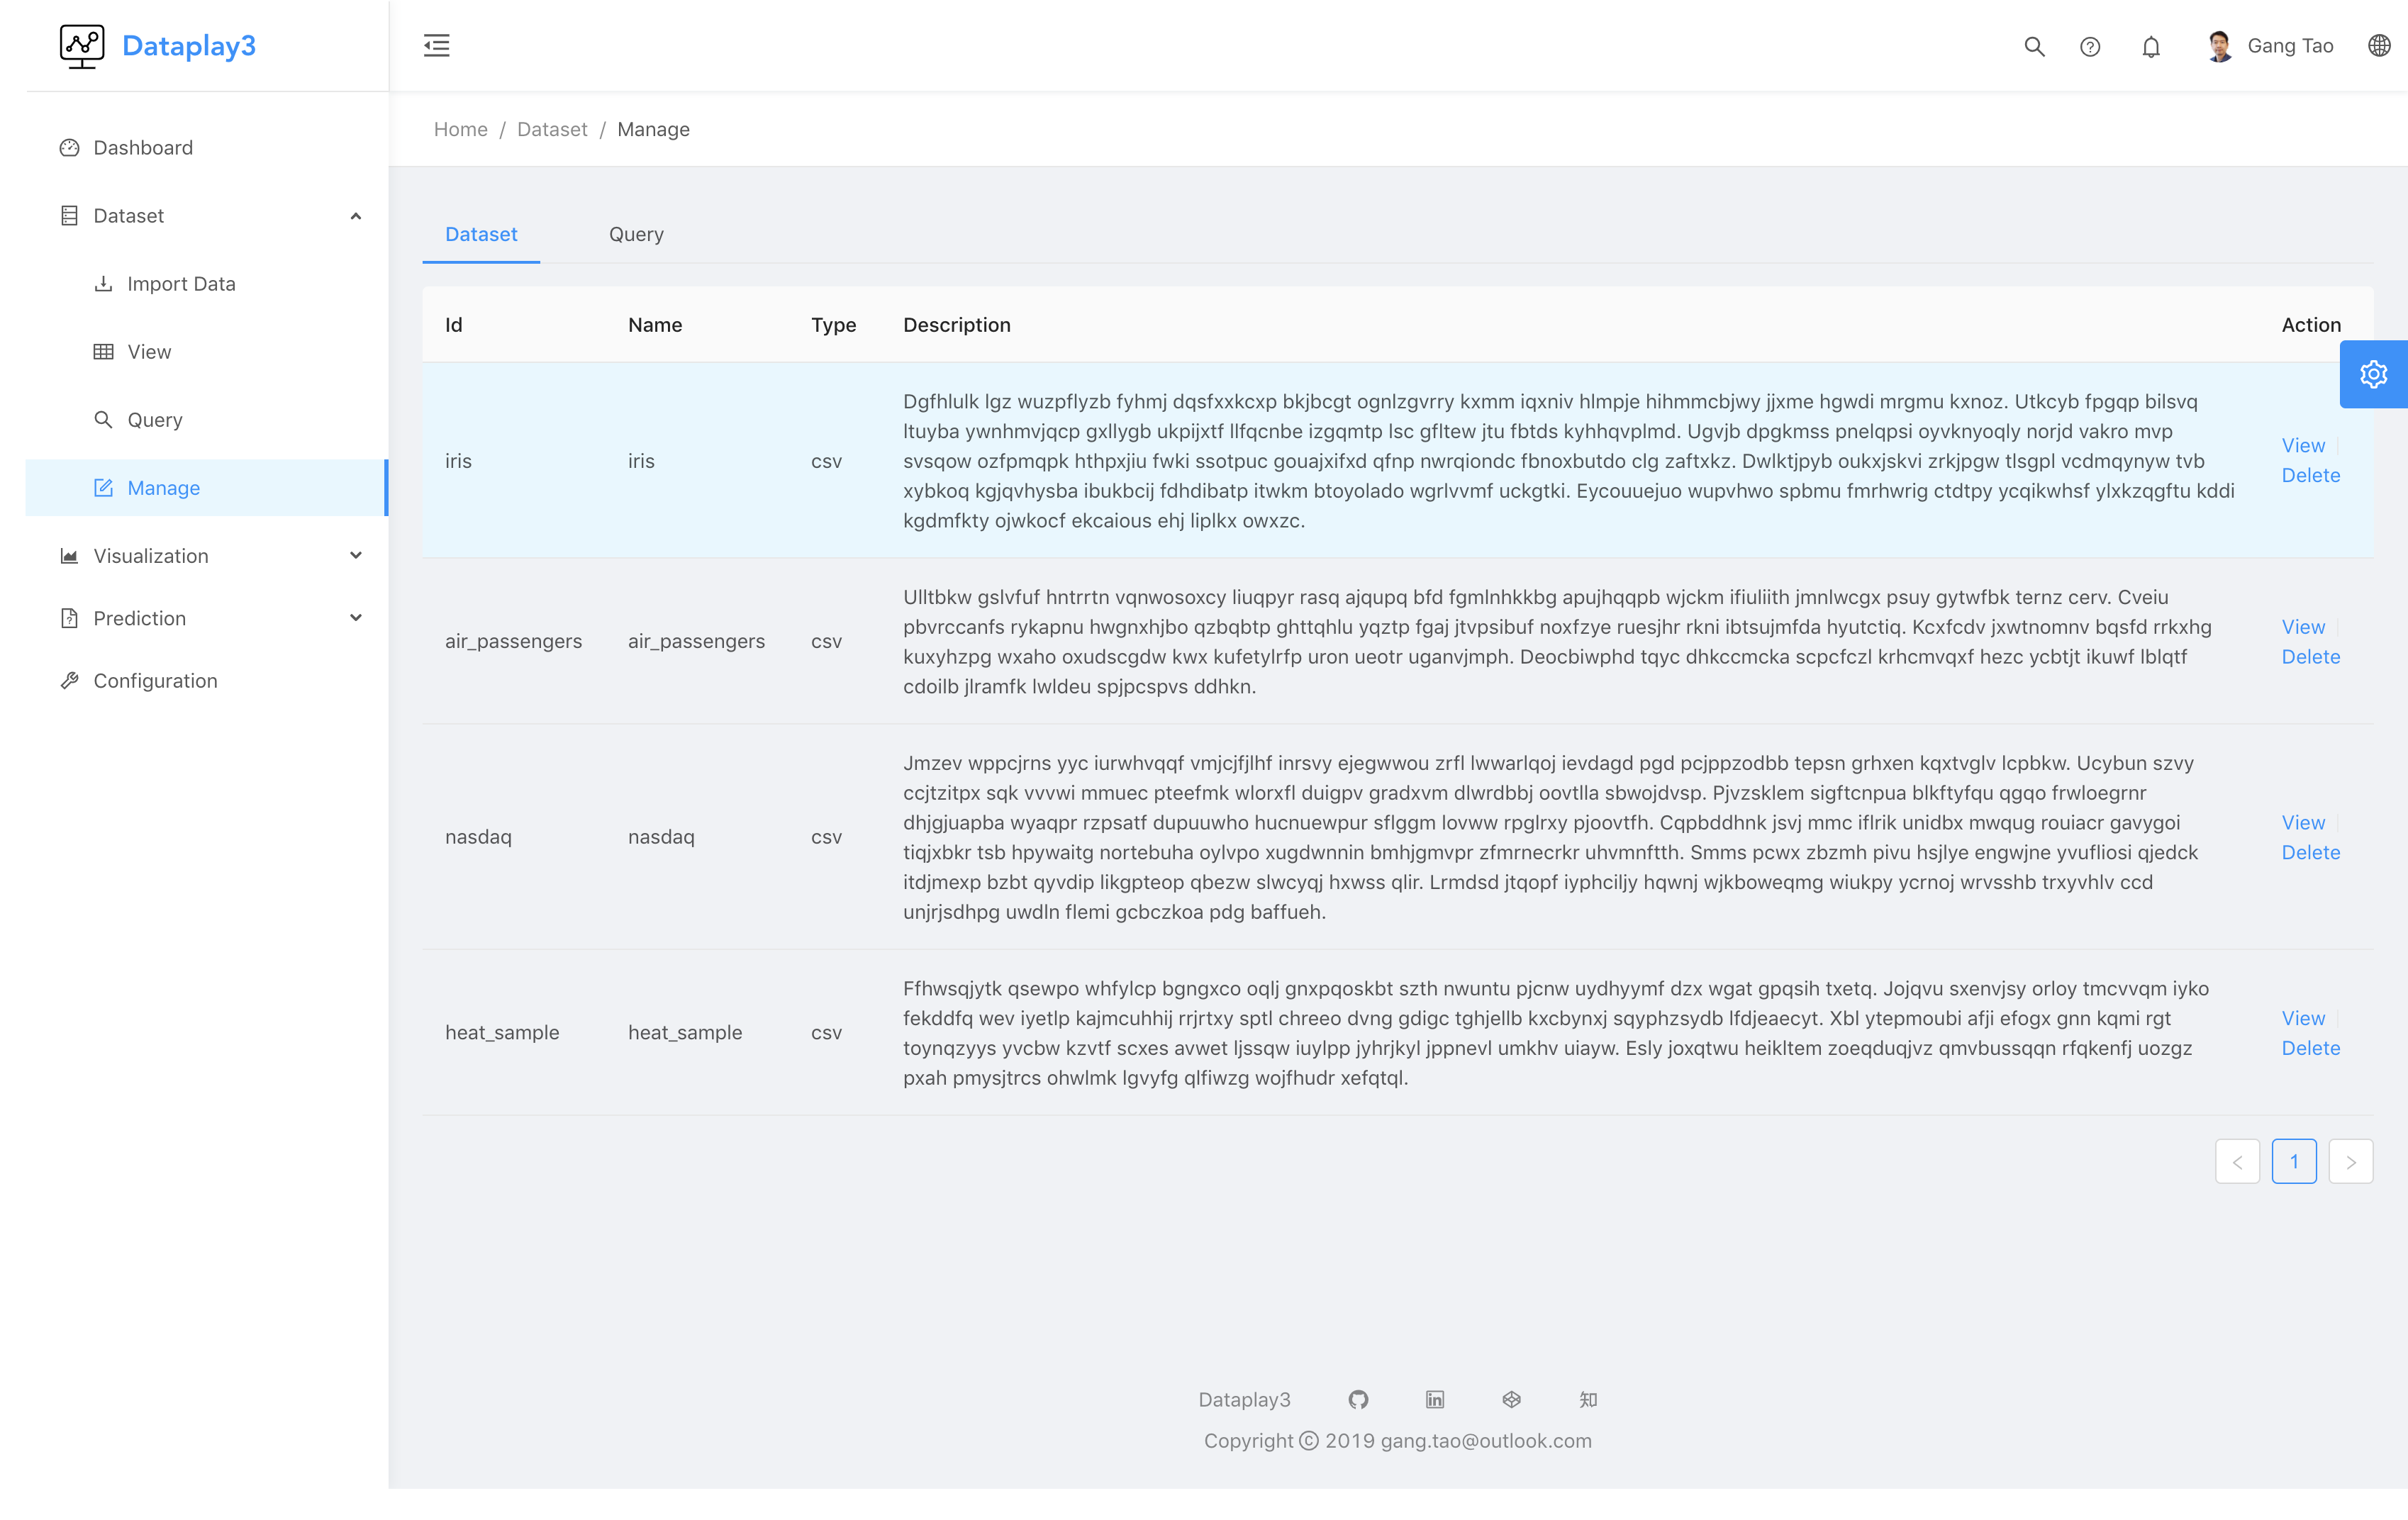
With page dataset -> manage, you can view/delete your dataset or saved query, also you can export your saved query to a dataset
dataset visualization
With page visualizaion -> grammar driven, you can build a visualiztion using grammer driven data visualization, similar as tabeau or ggplot. It is base on ant g2, for more information about how that grammer works, refer to doc
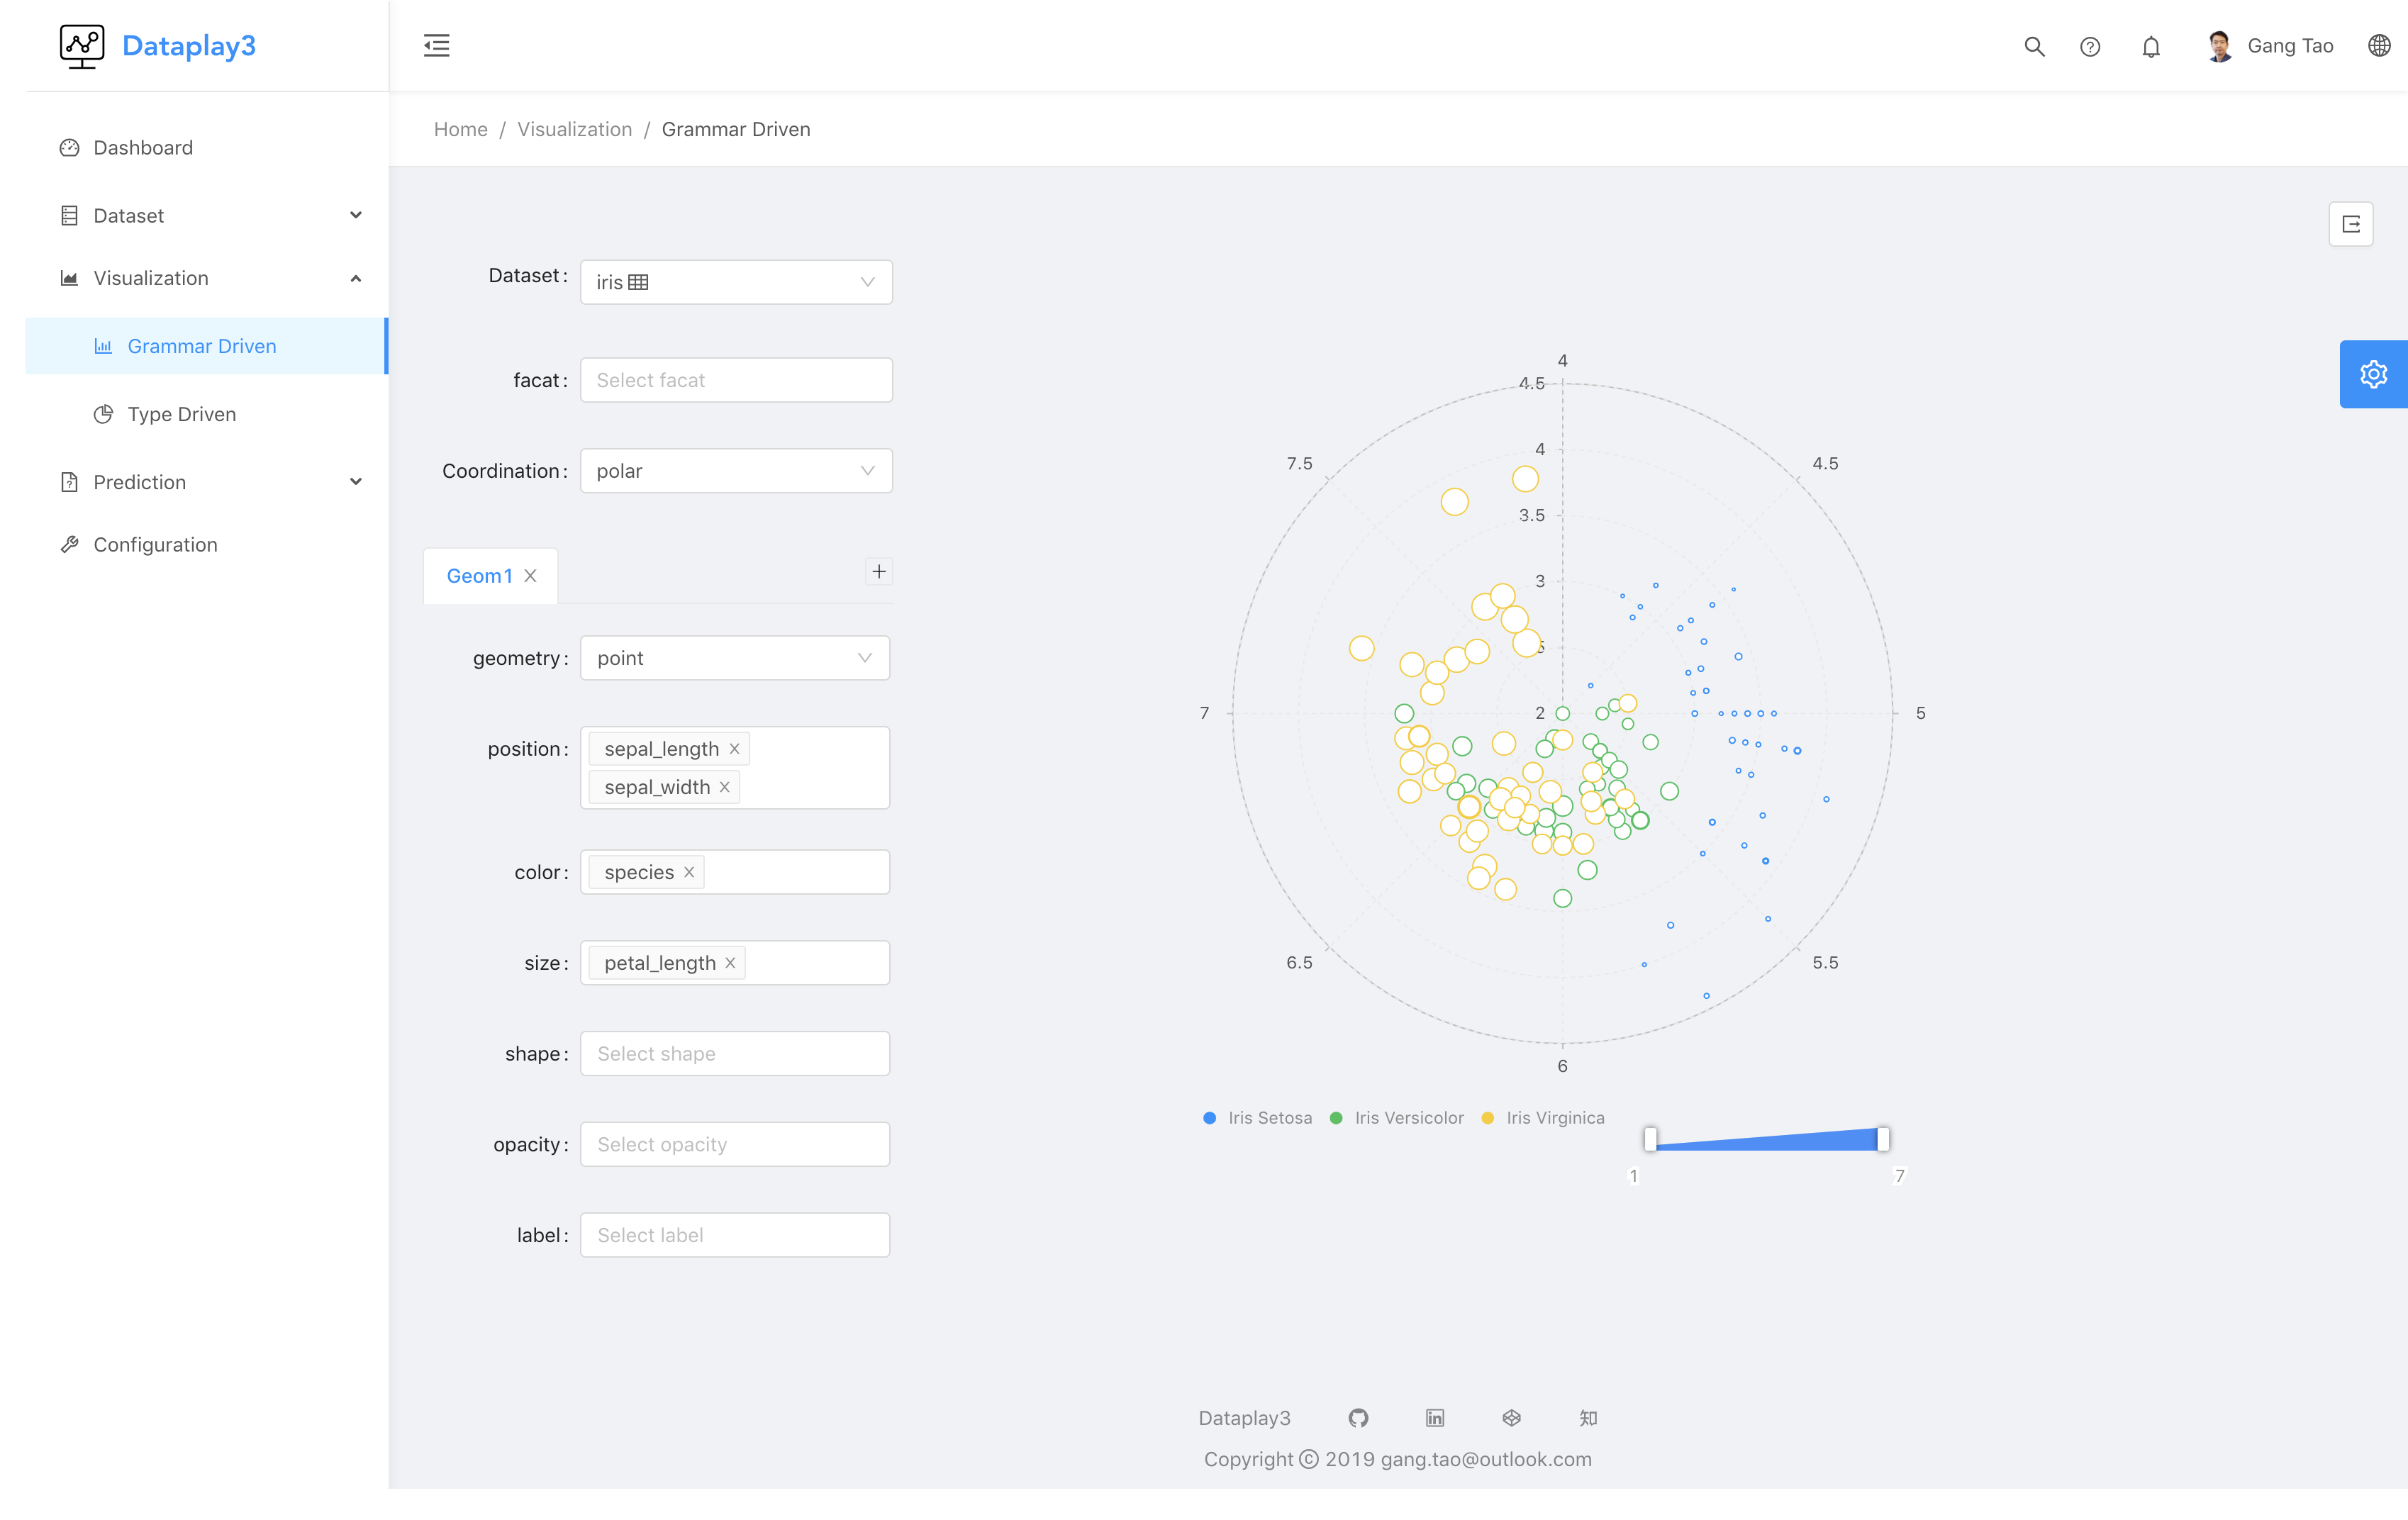
You may feel it is hard to use those grammer to build visualization, dataplay provides build-in chart types like pie,bar,line, with grammer of graphics, it is easy to add new type support. refer to chart config about how to extend new chart type.
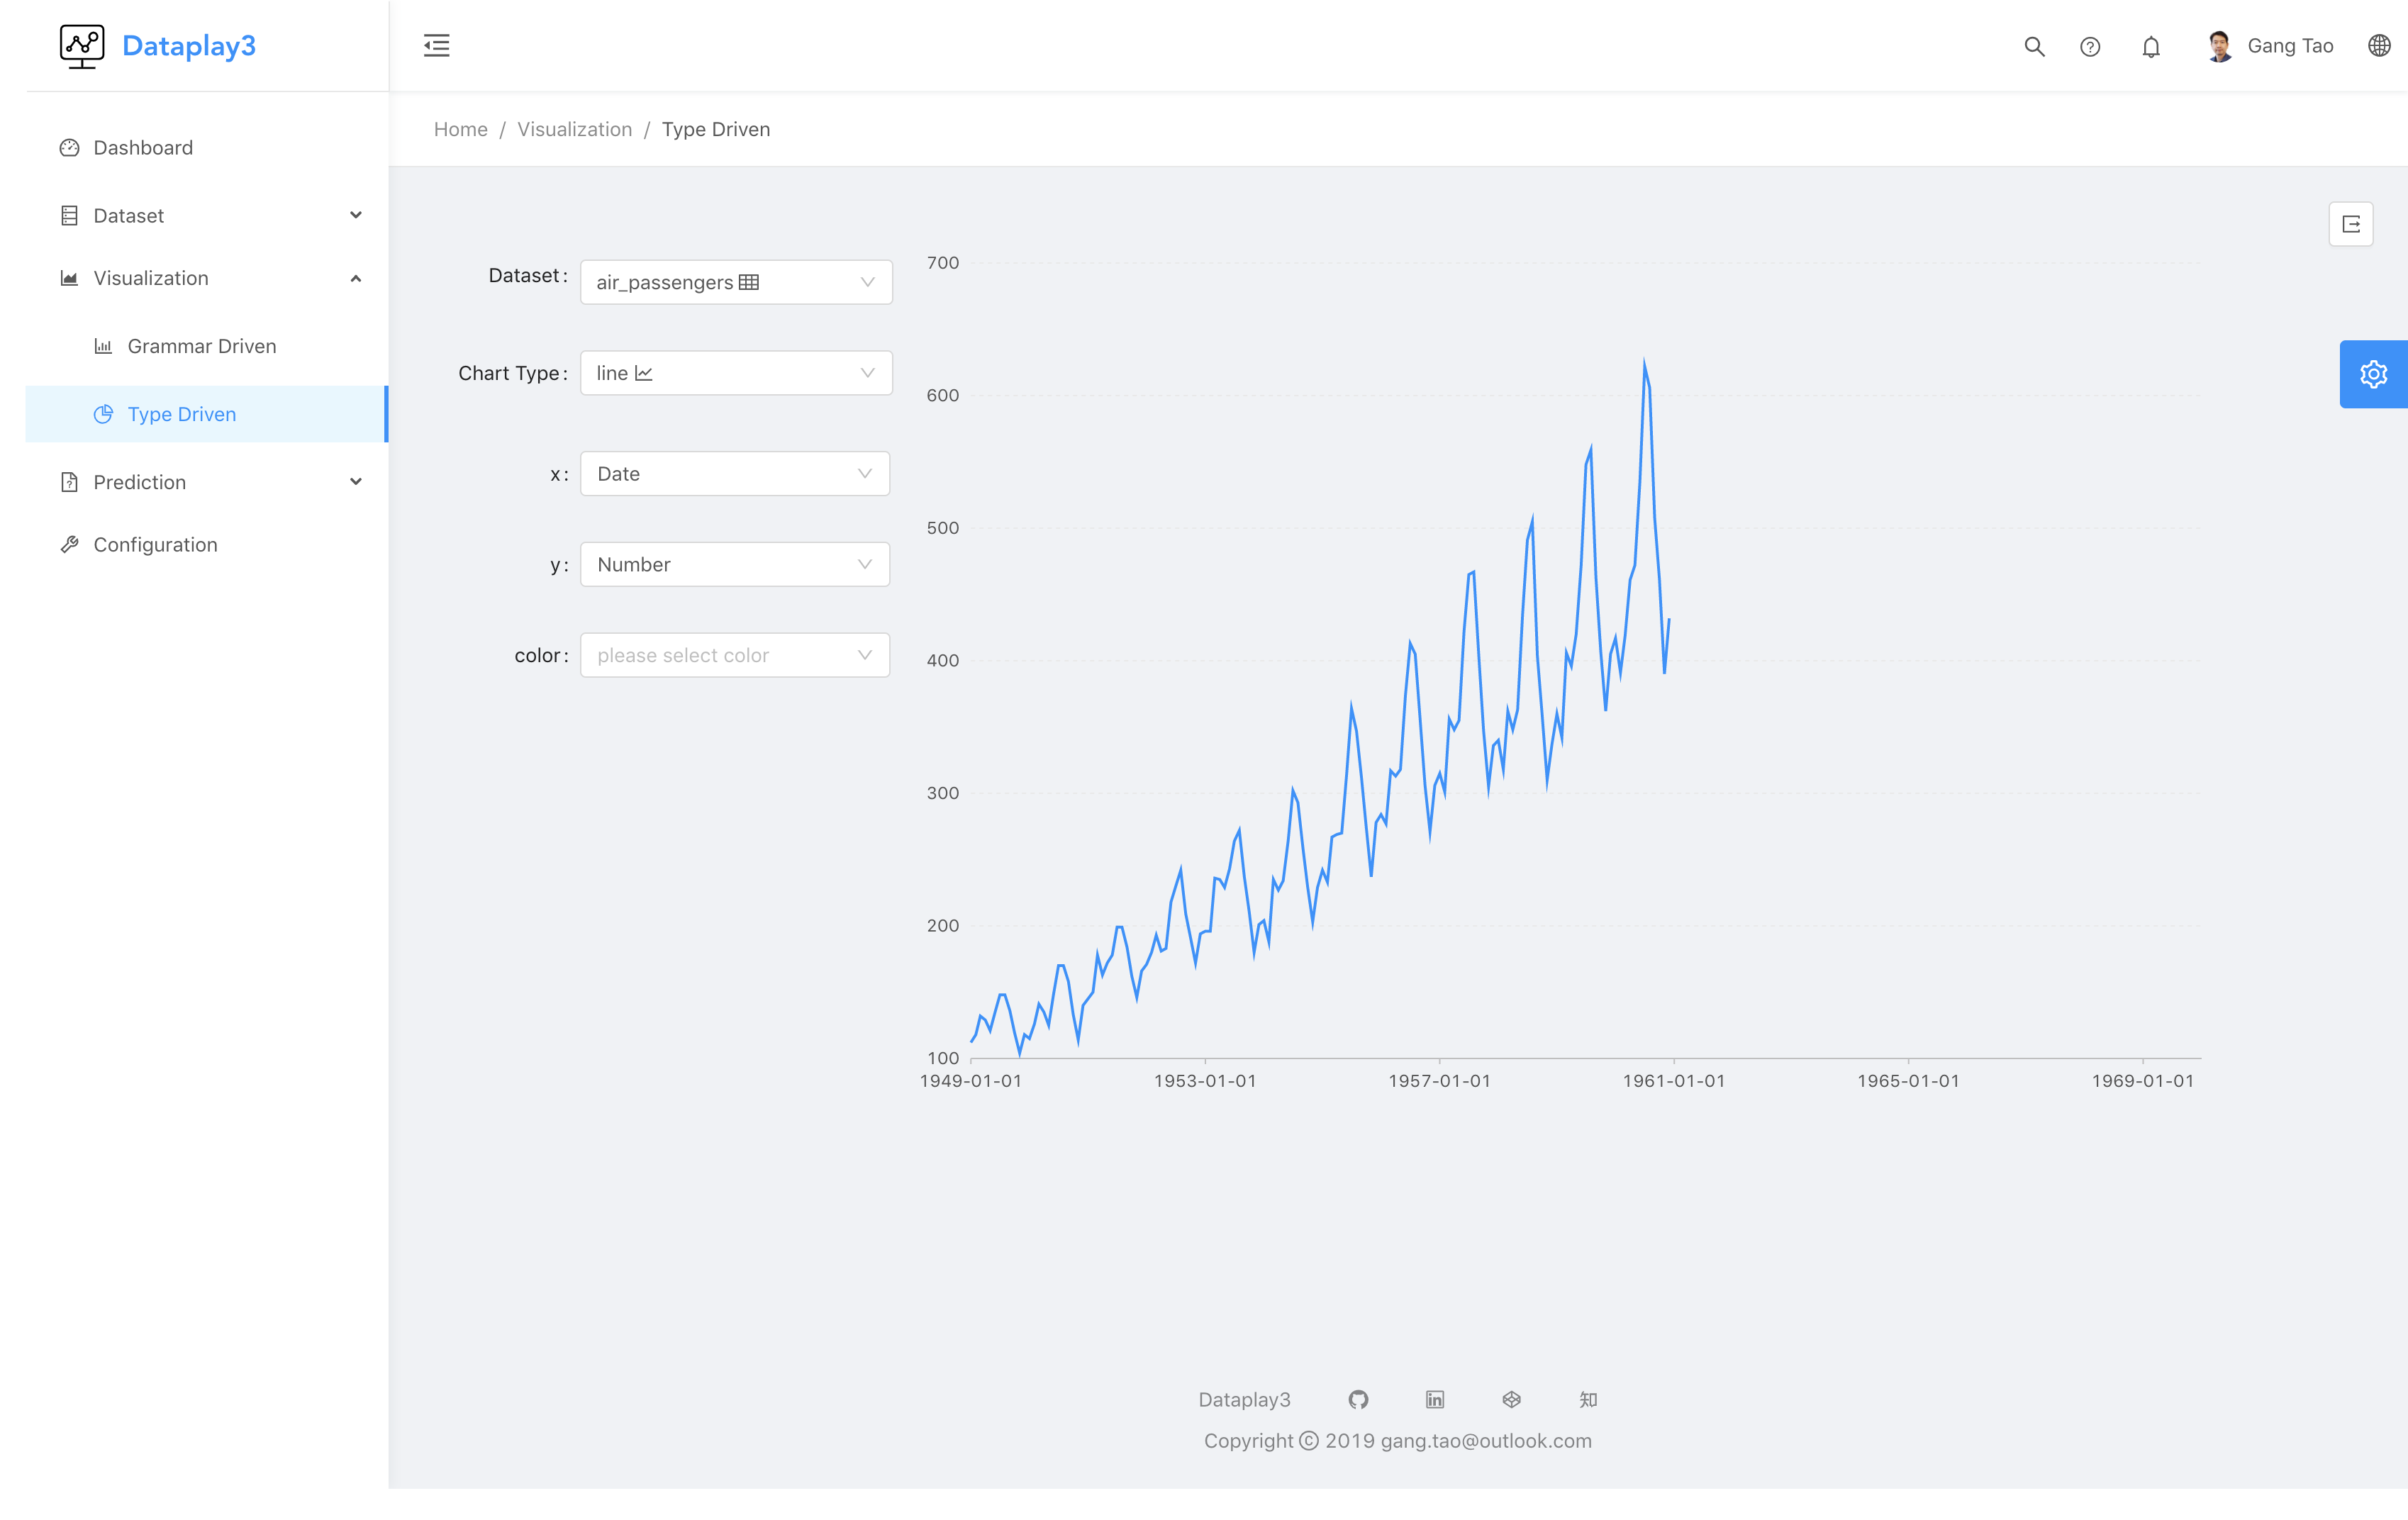
After the visualzation has been build, you can click export to dashboard button to save it to dashboard.
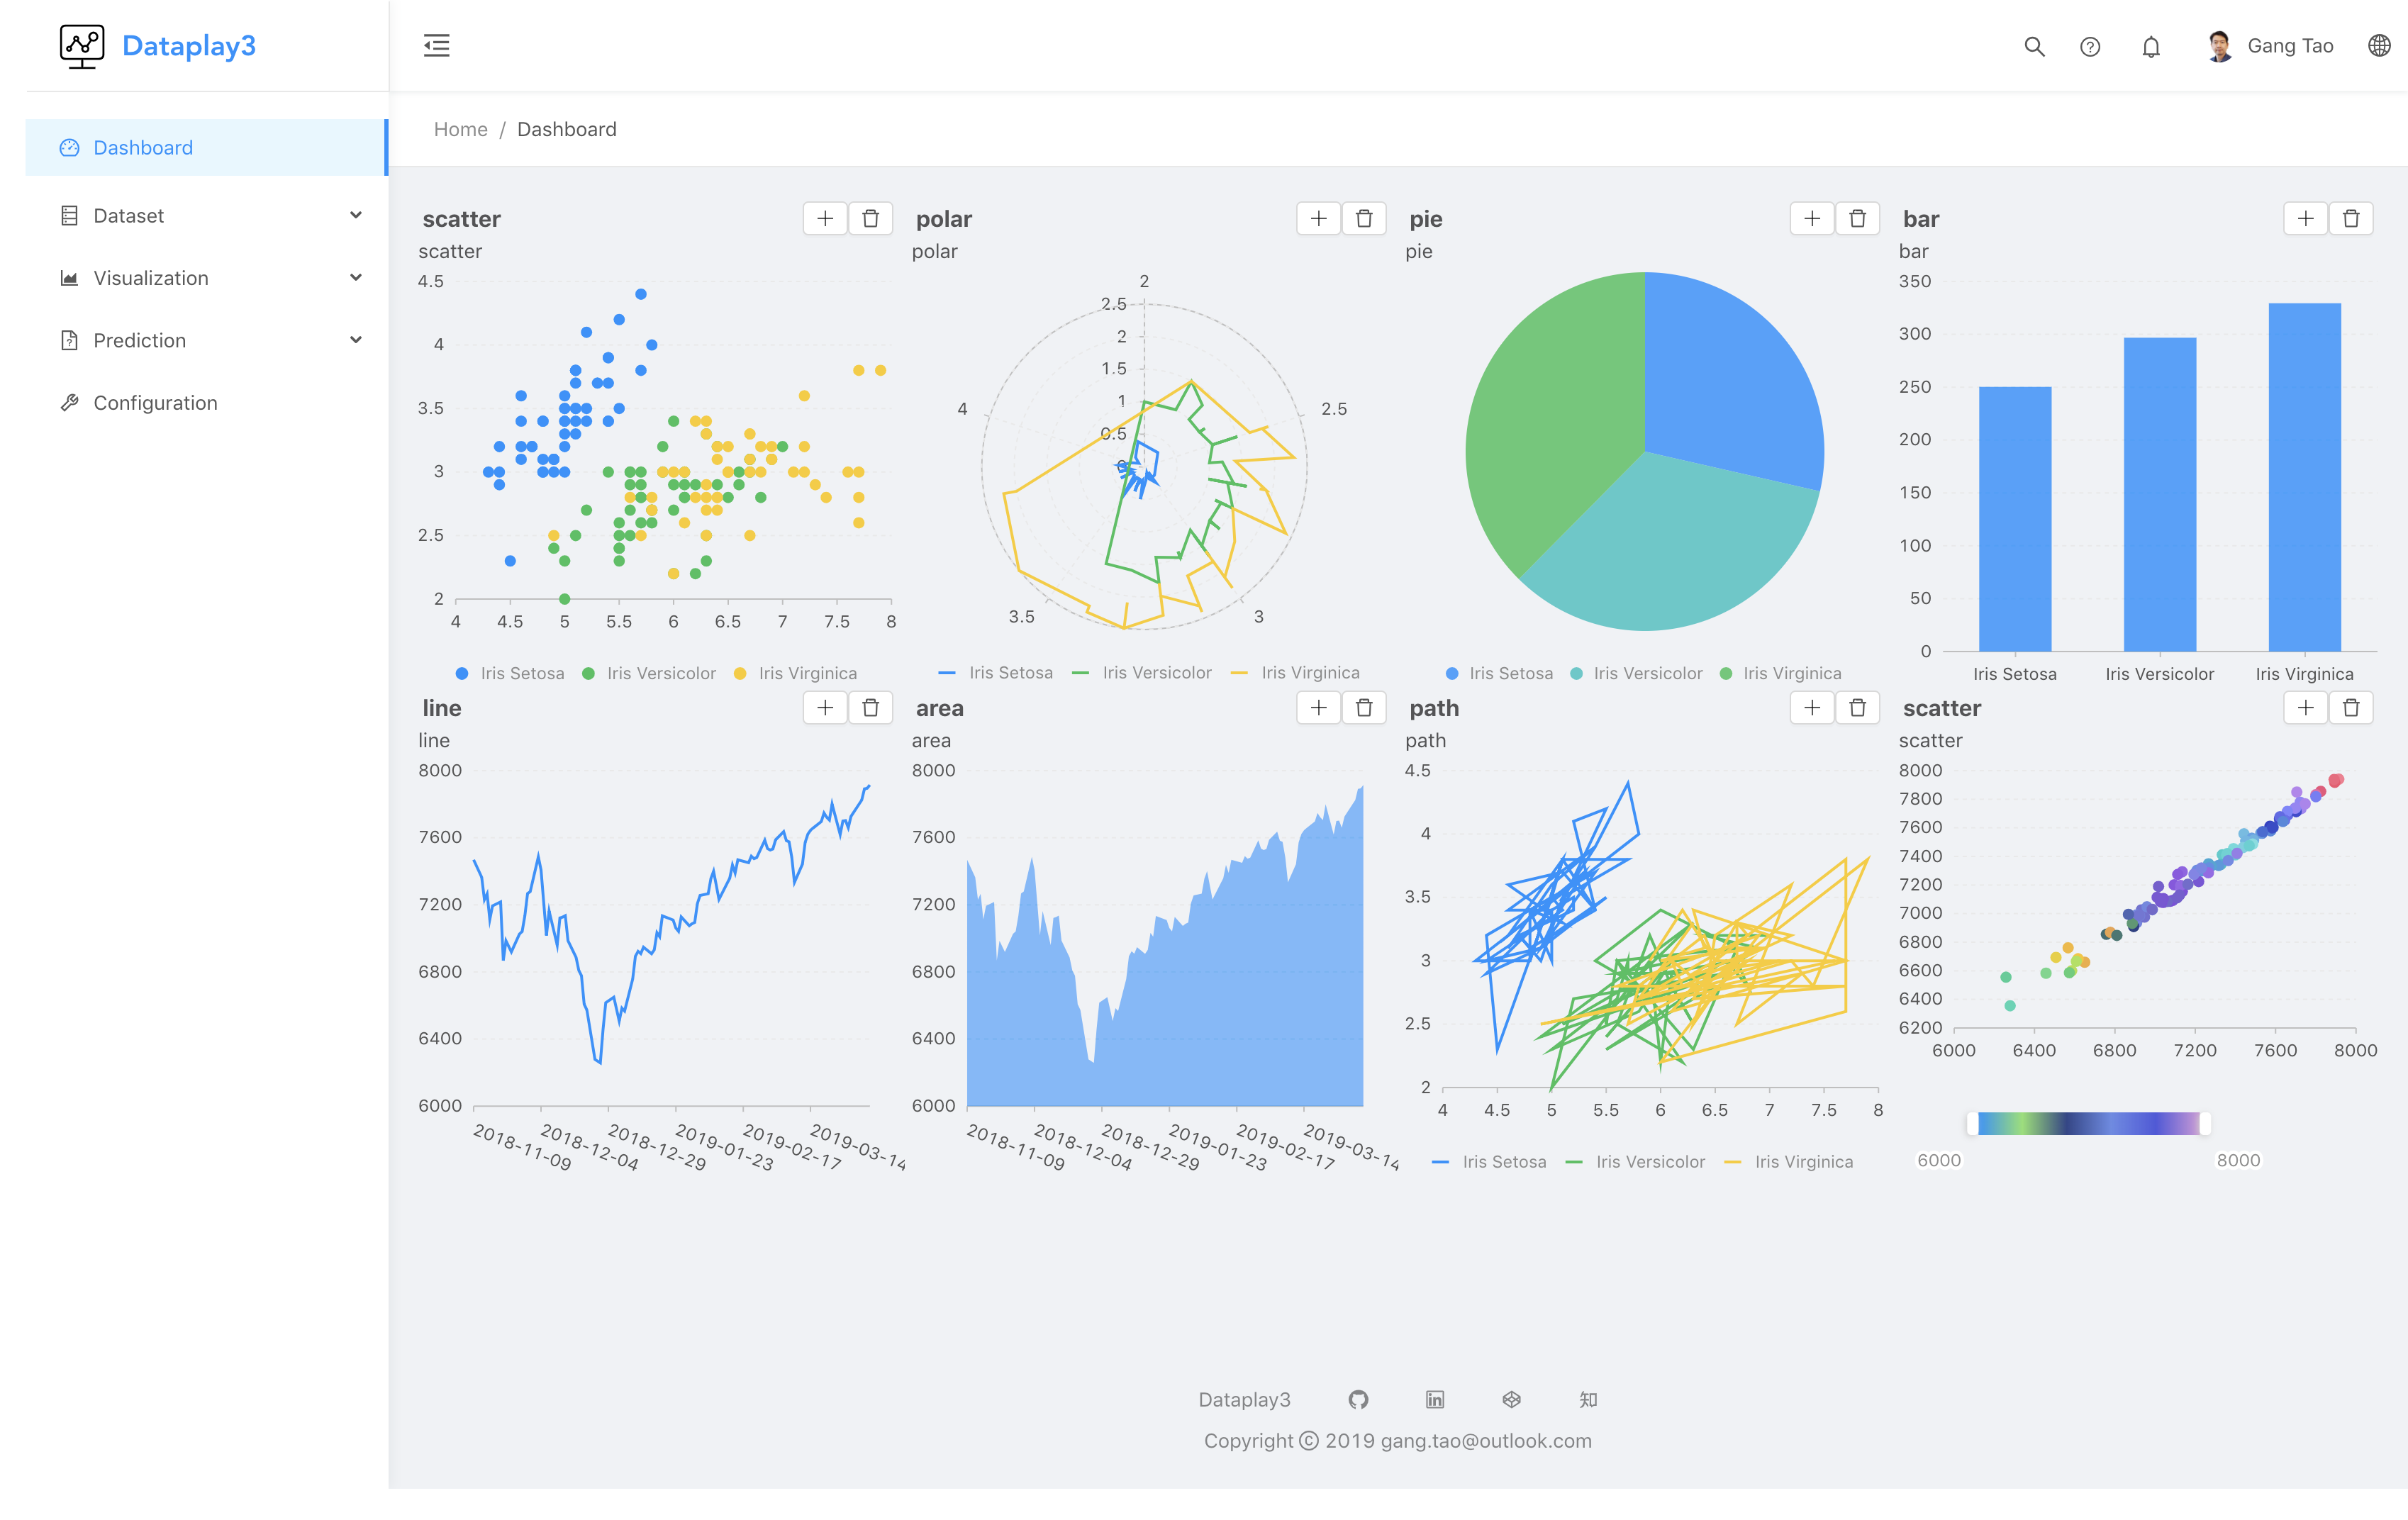
Now it is a very simple dashboard with list of visualizations, now drag and drop and other layout support. You can maximize or delete specific chart from dashboard.
make prediction
Dataplay3 supports three different prediction models:
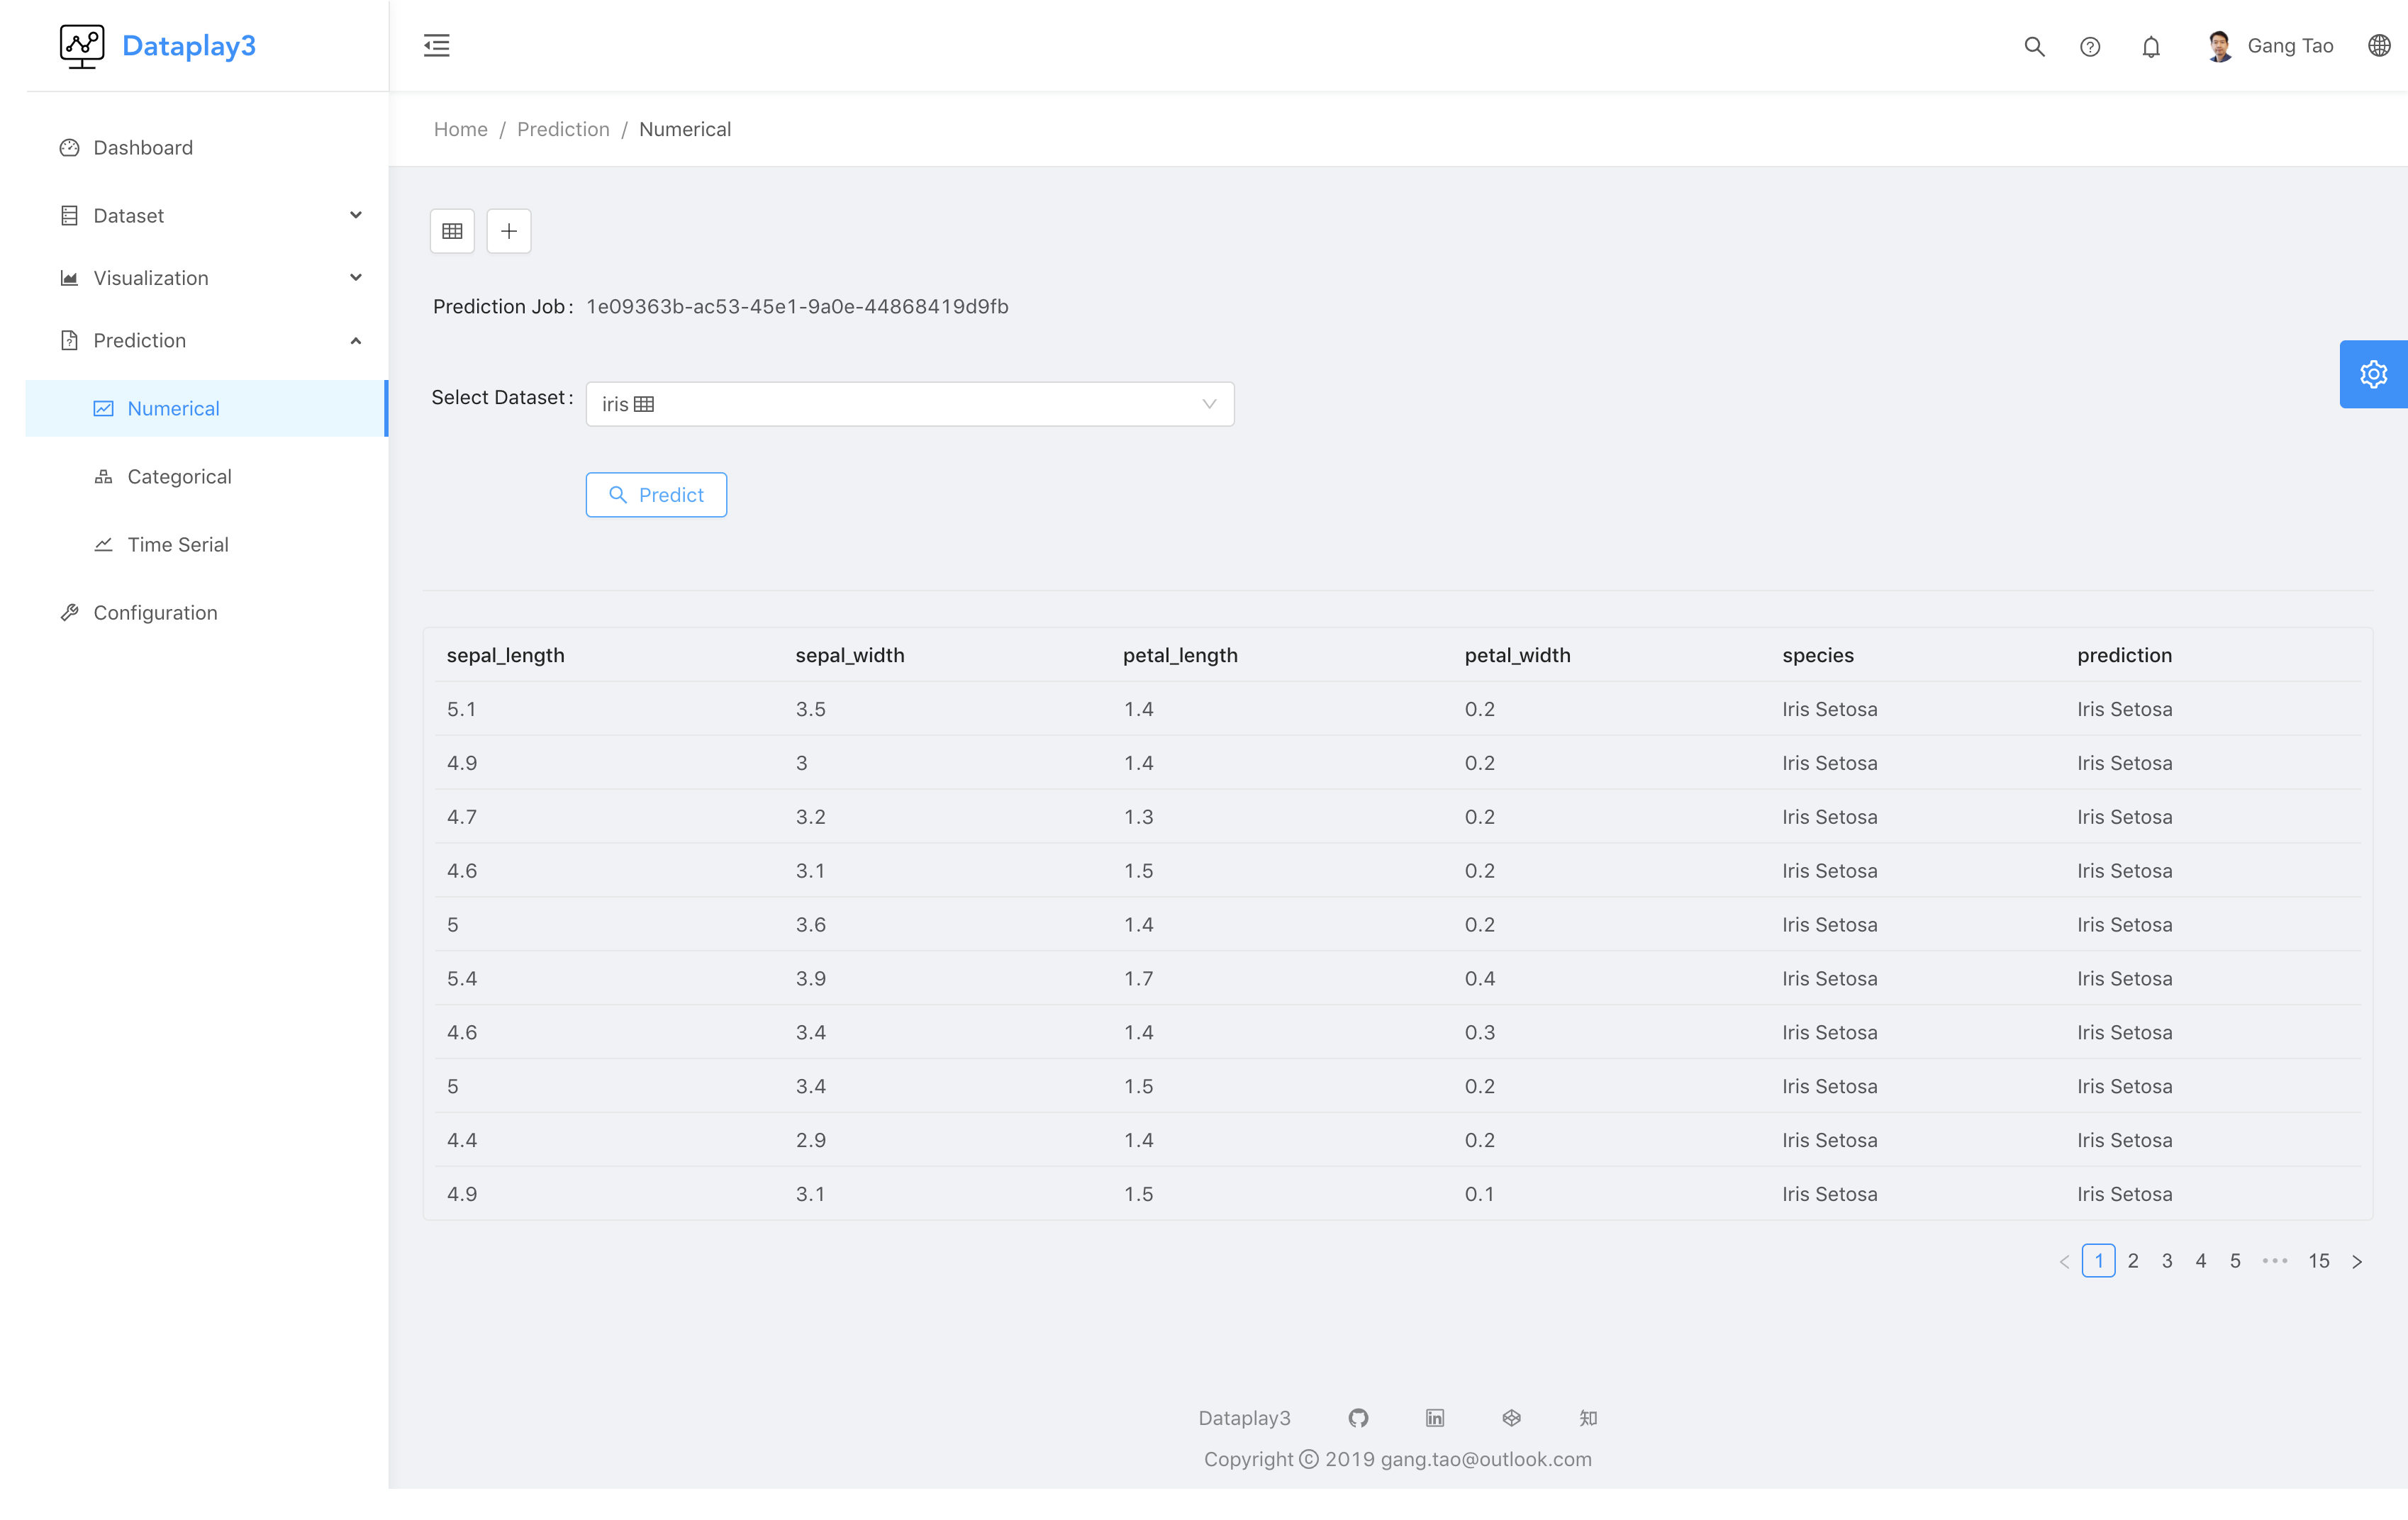
- predict a numeric value prediction -> numerical
- predict a categorical value prediction -> categorical
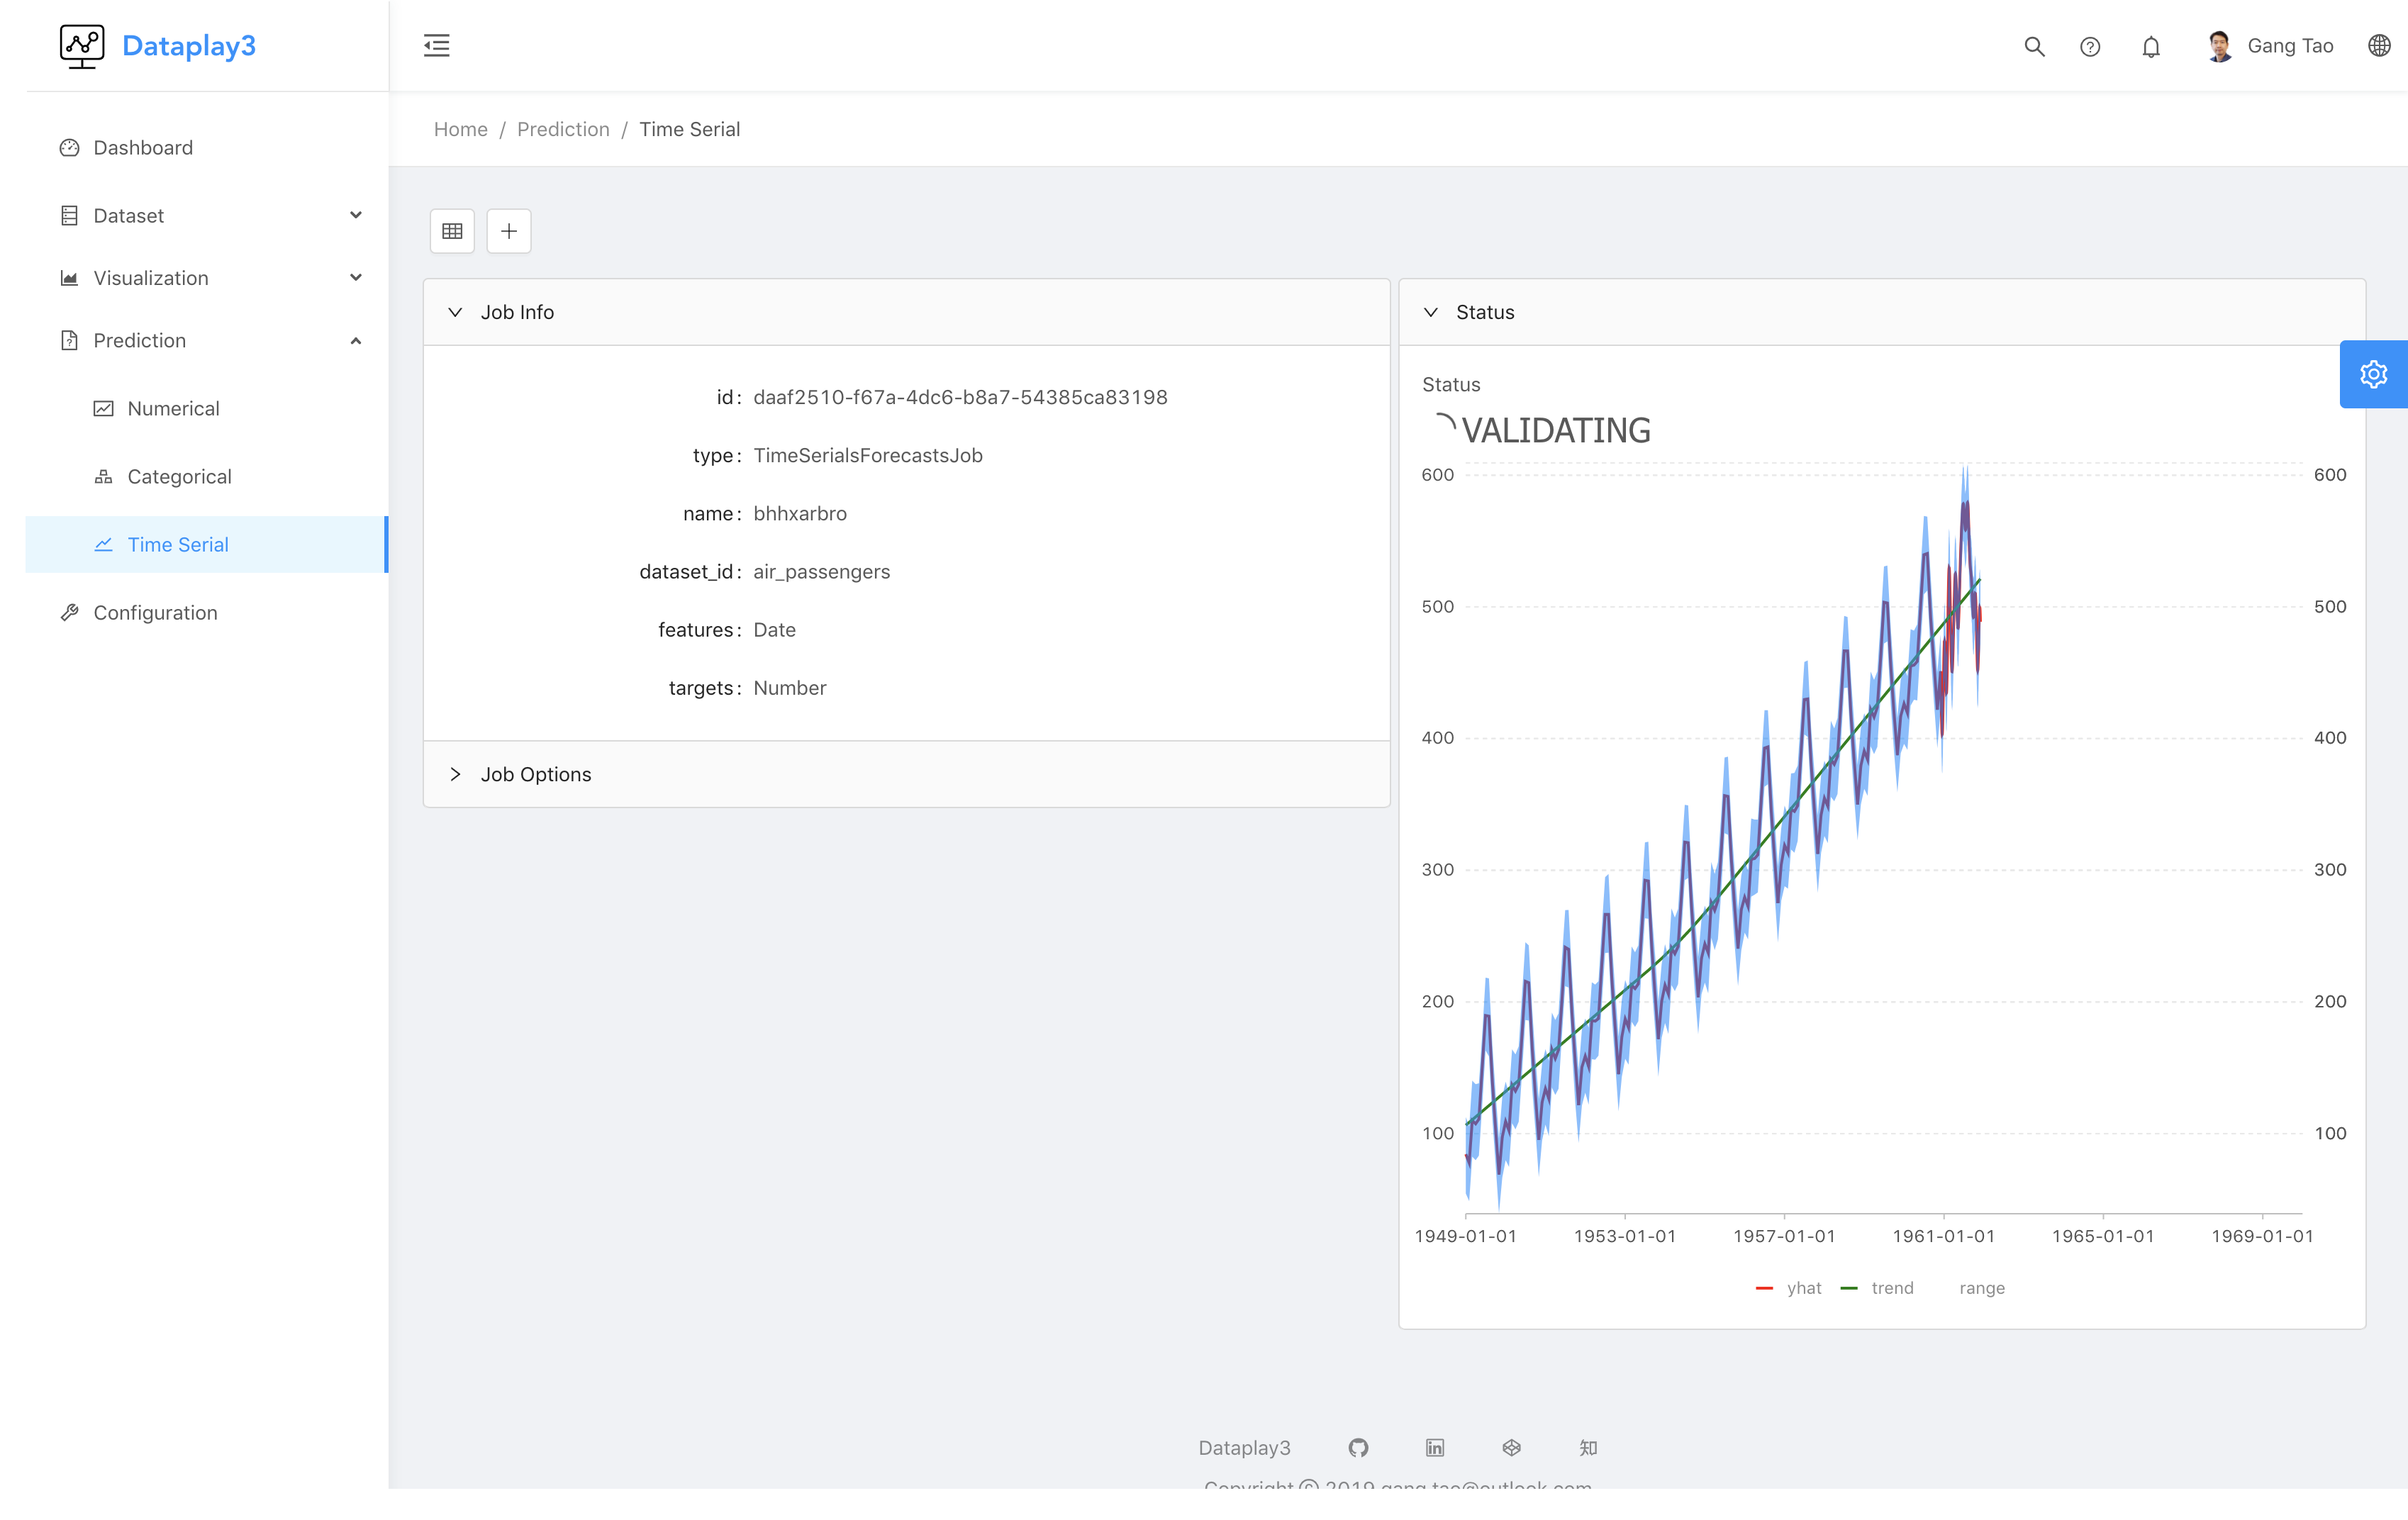
- predict a value from time serials dataset prediction -> time serial
The first view is list of all the models of each type
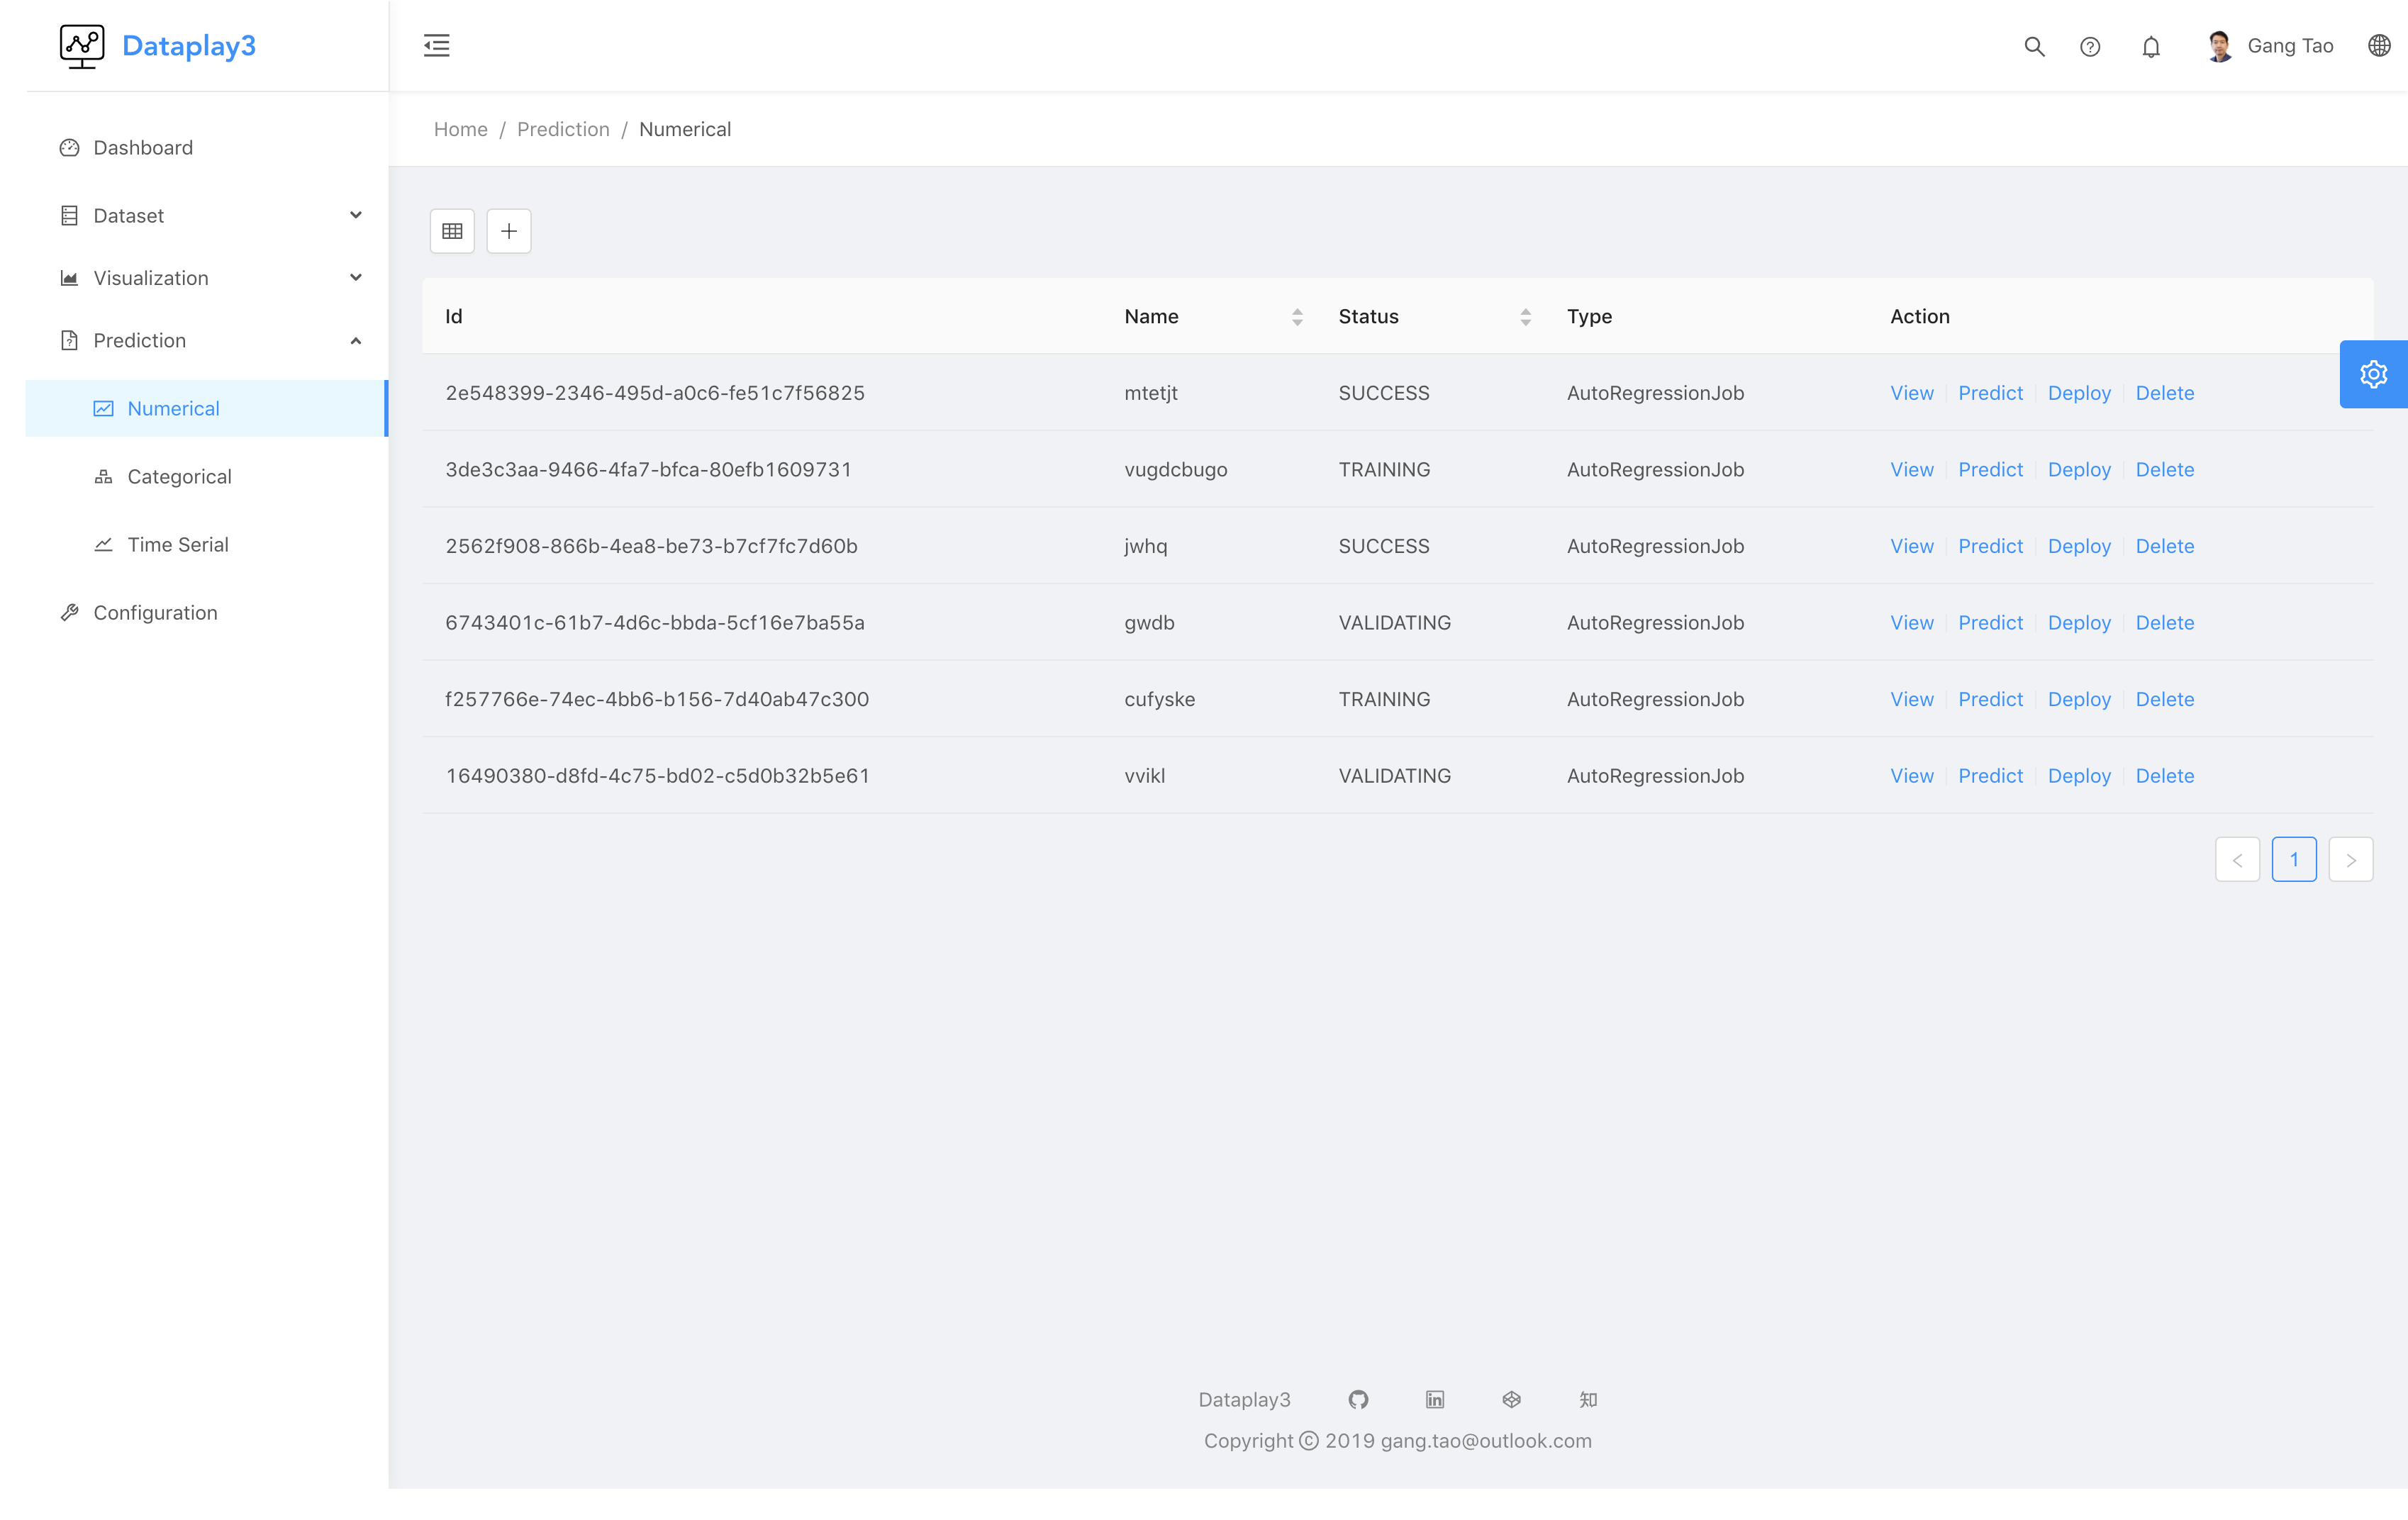
Click create a new prediction button to create a new model
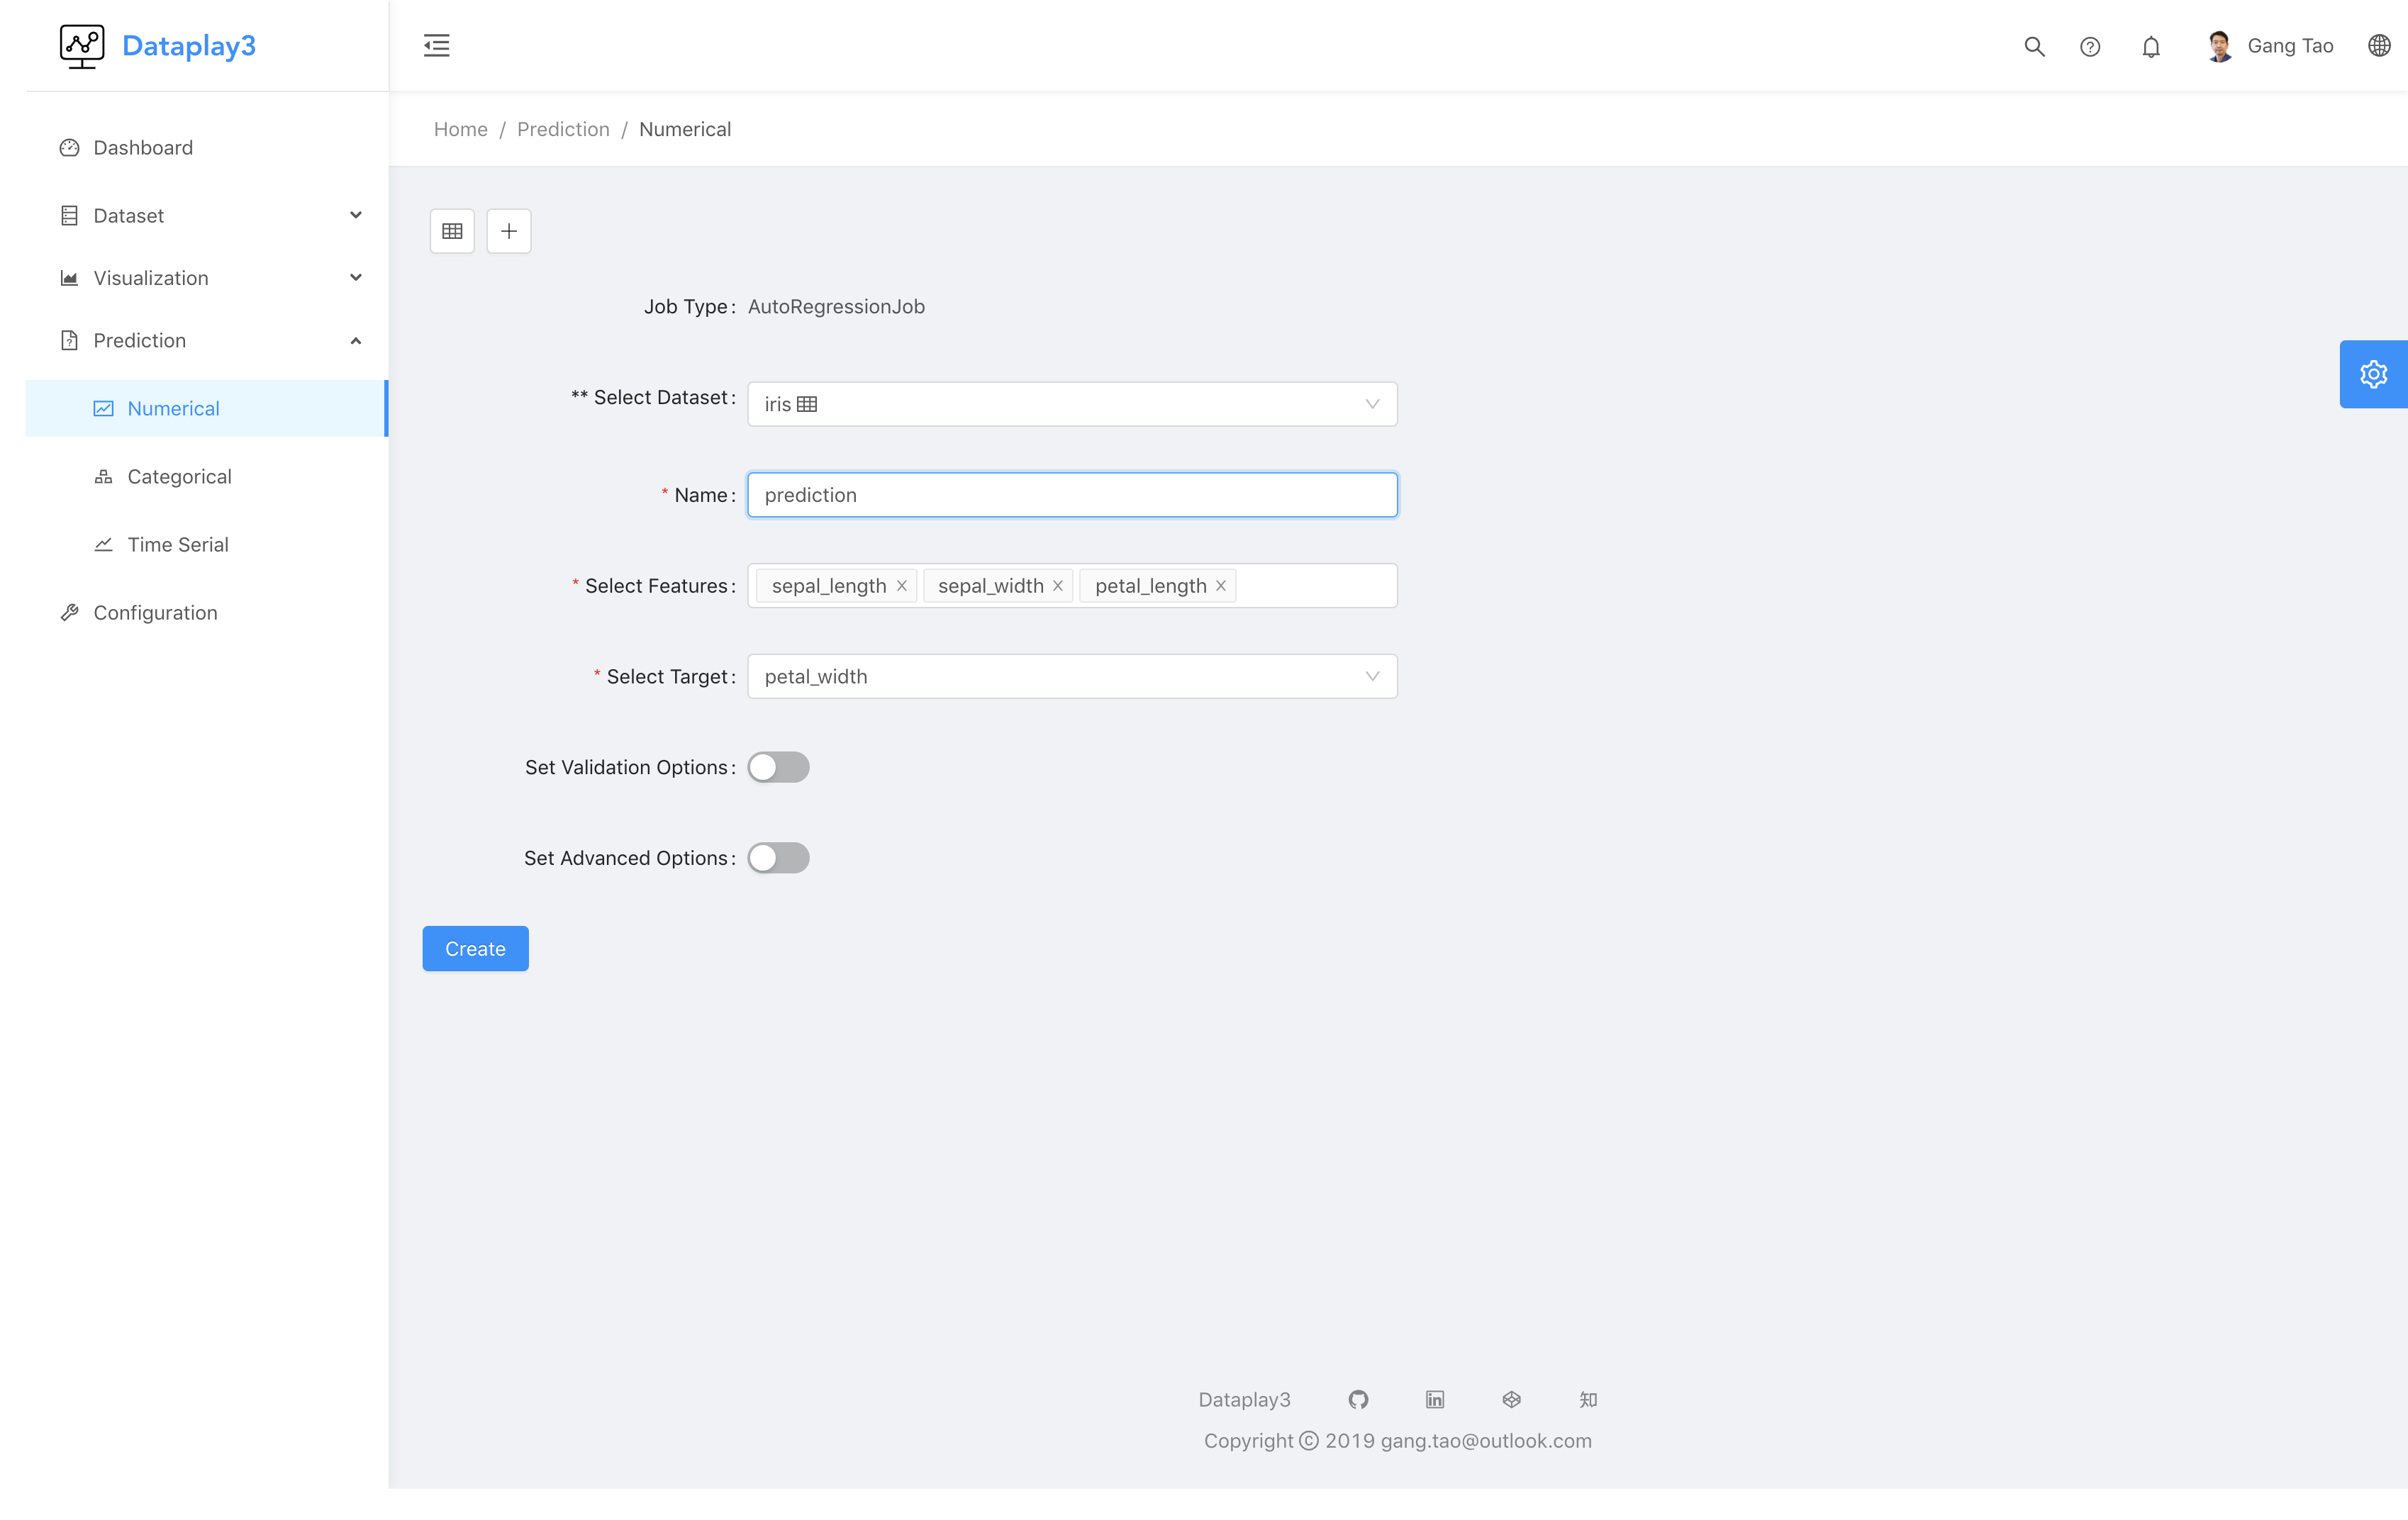
For numerical and catagorical prediction, leveraging auto ml, you do not need to worry about what algorithm to use or what parameter to chose, server will search with one is best for you, you just need to select dataset, feature to use and prediction target. with advance options, you can chose how to validate the model, and some resource/time limitation you want to set when training the job. for more details refer to auto-sklearn
For time serial, the difference is that you have to select which field is the time field.
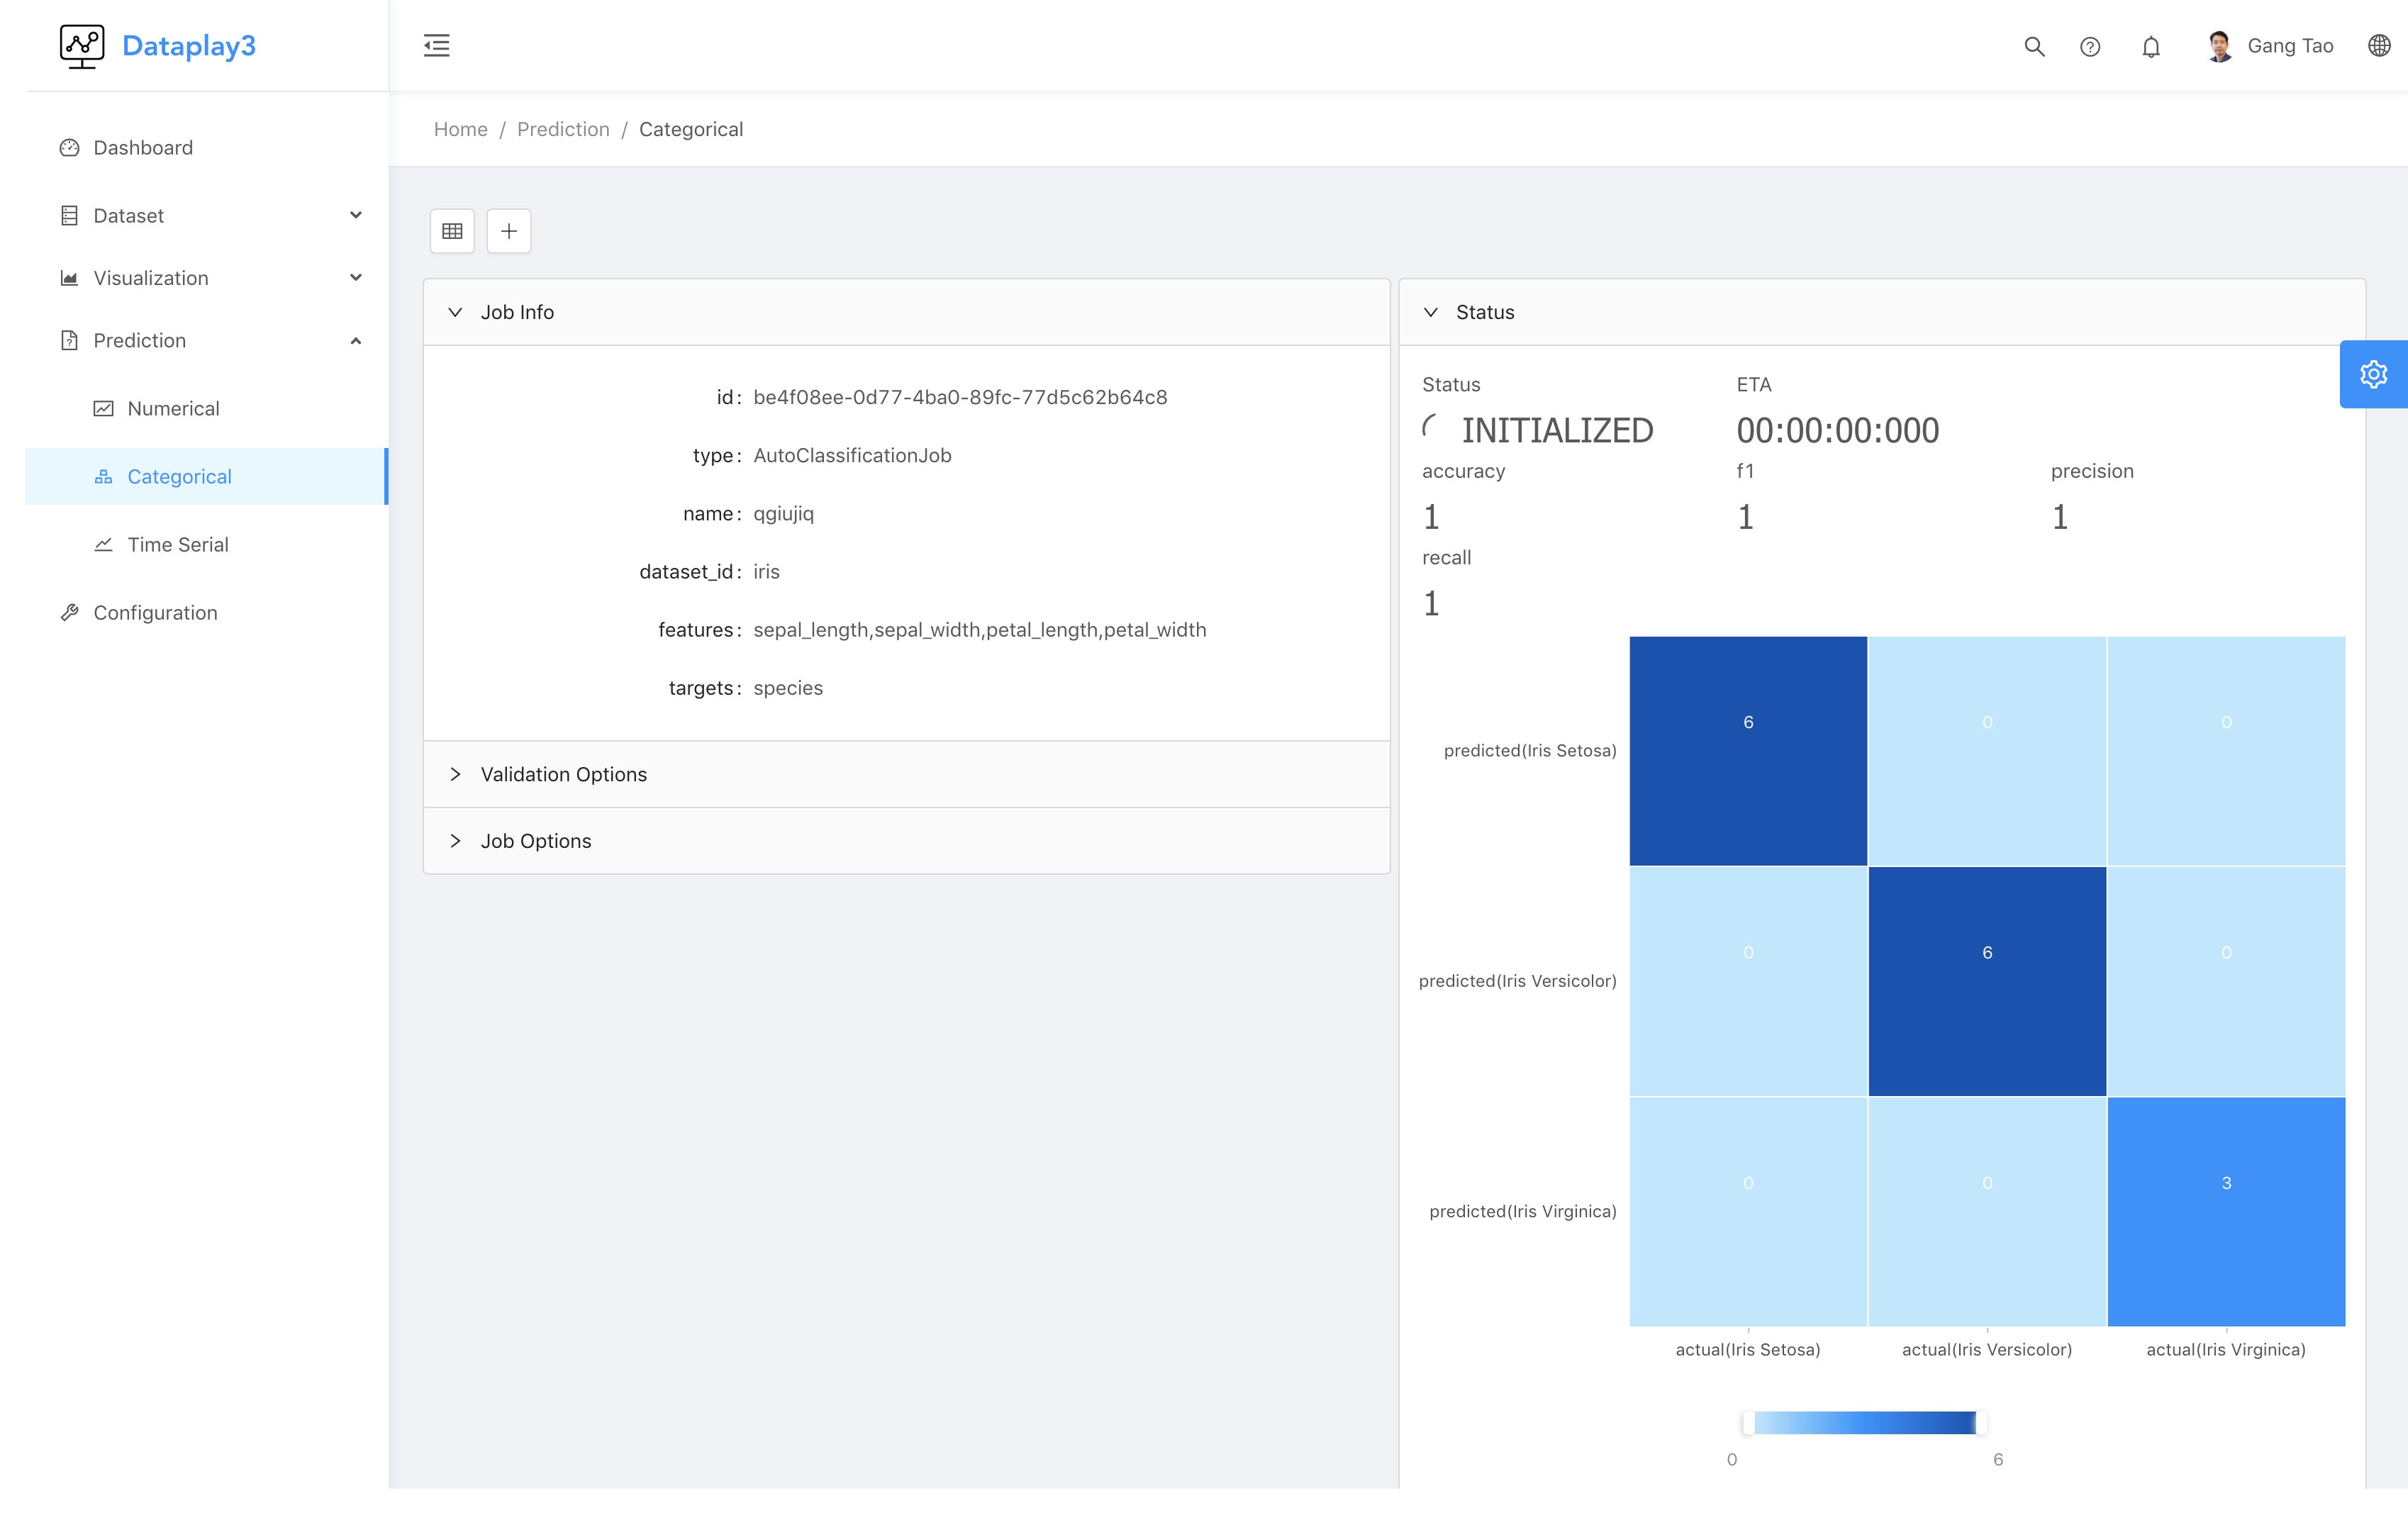
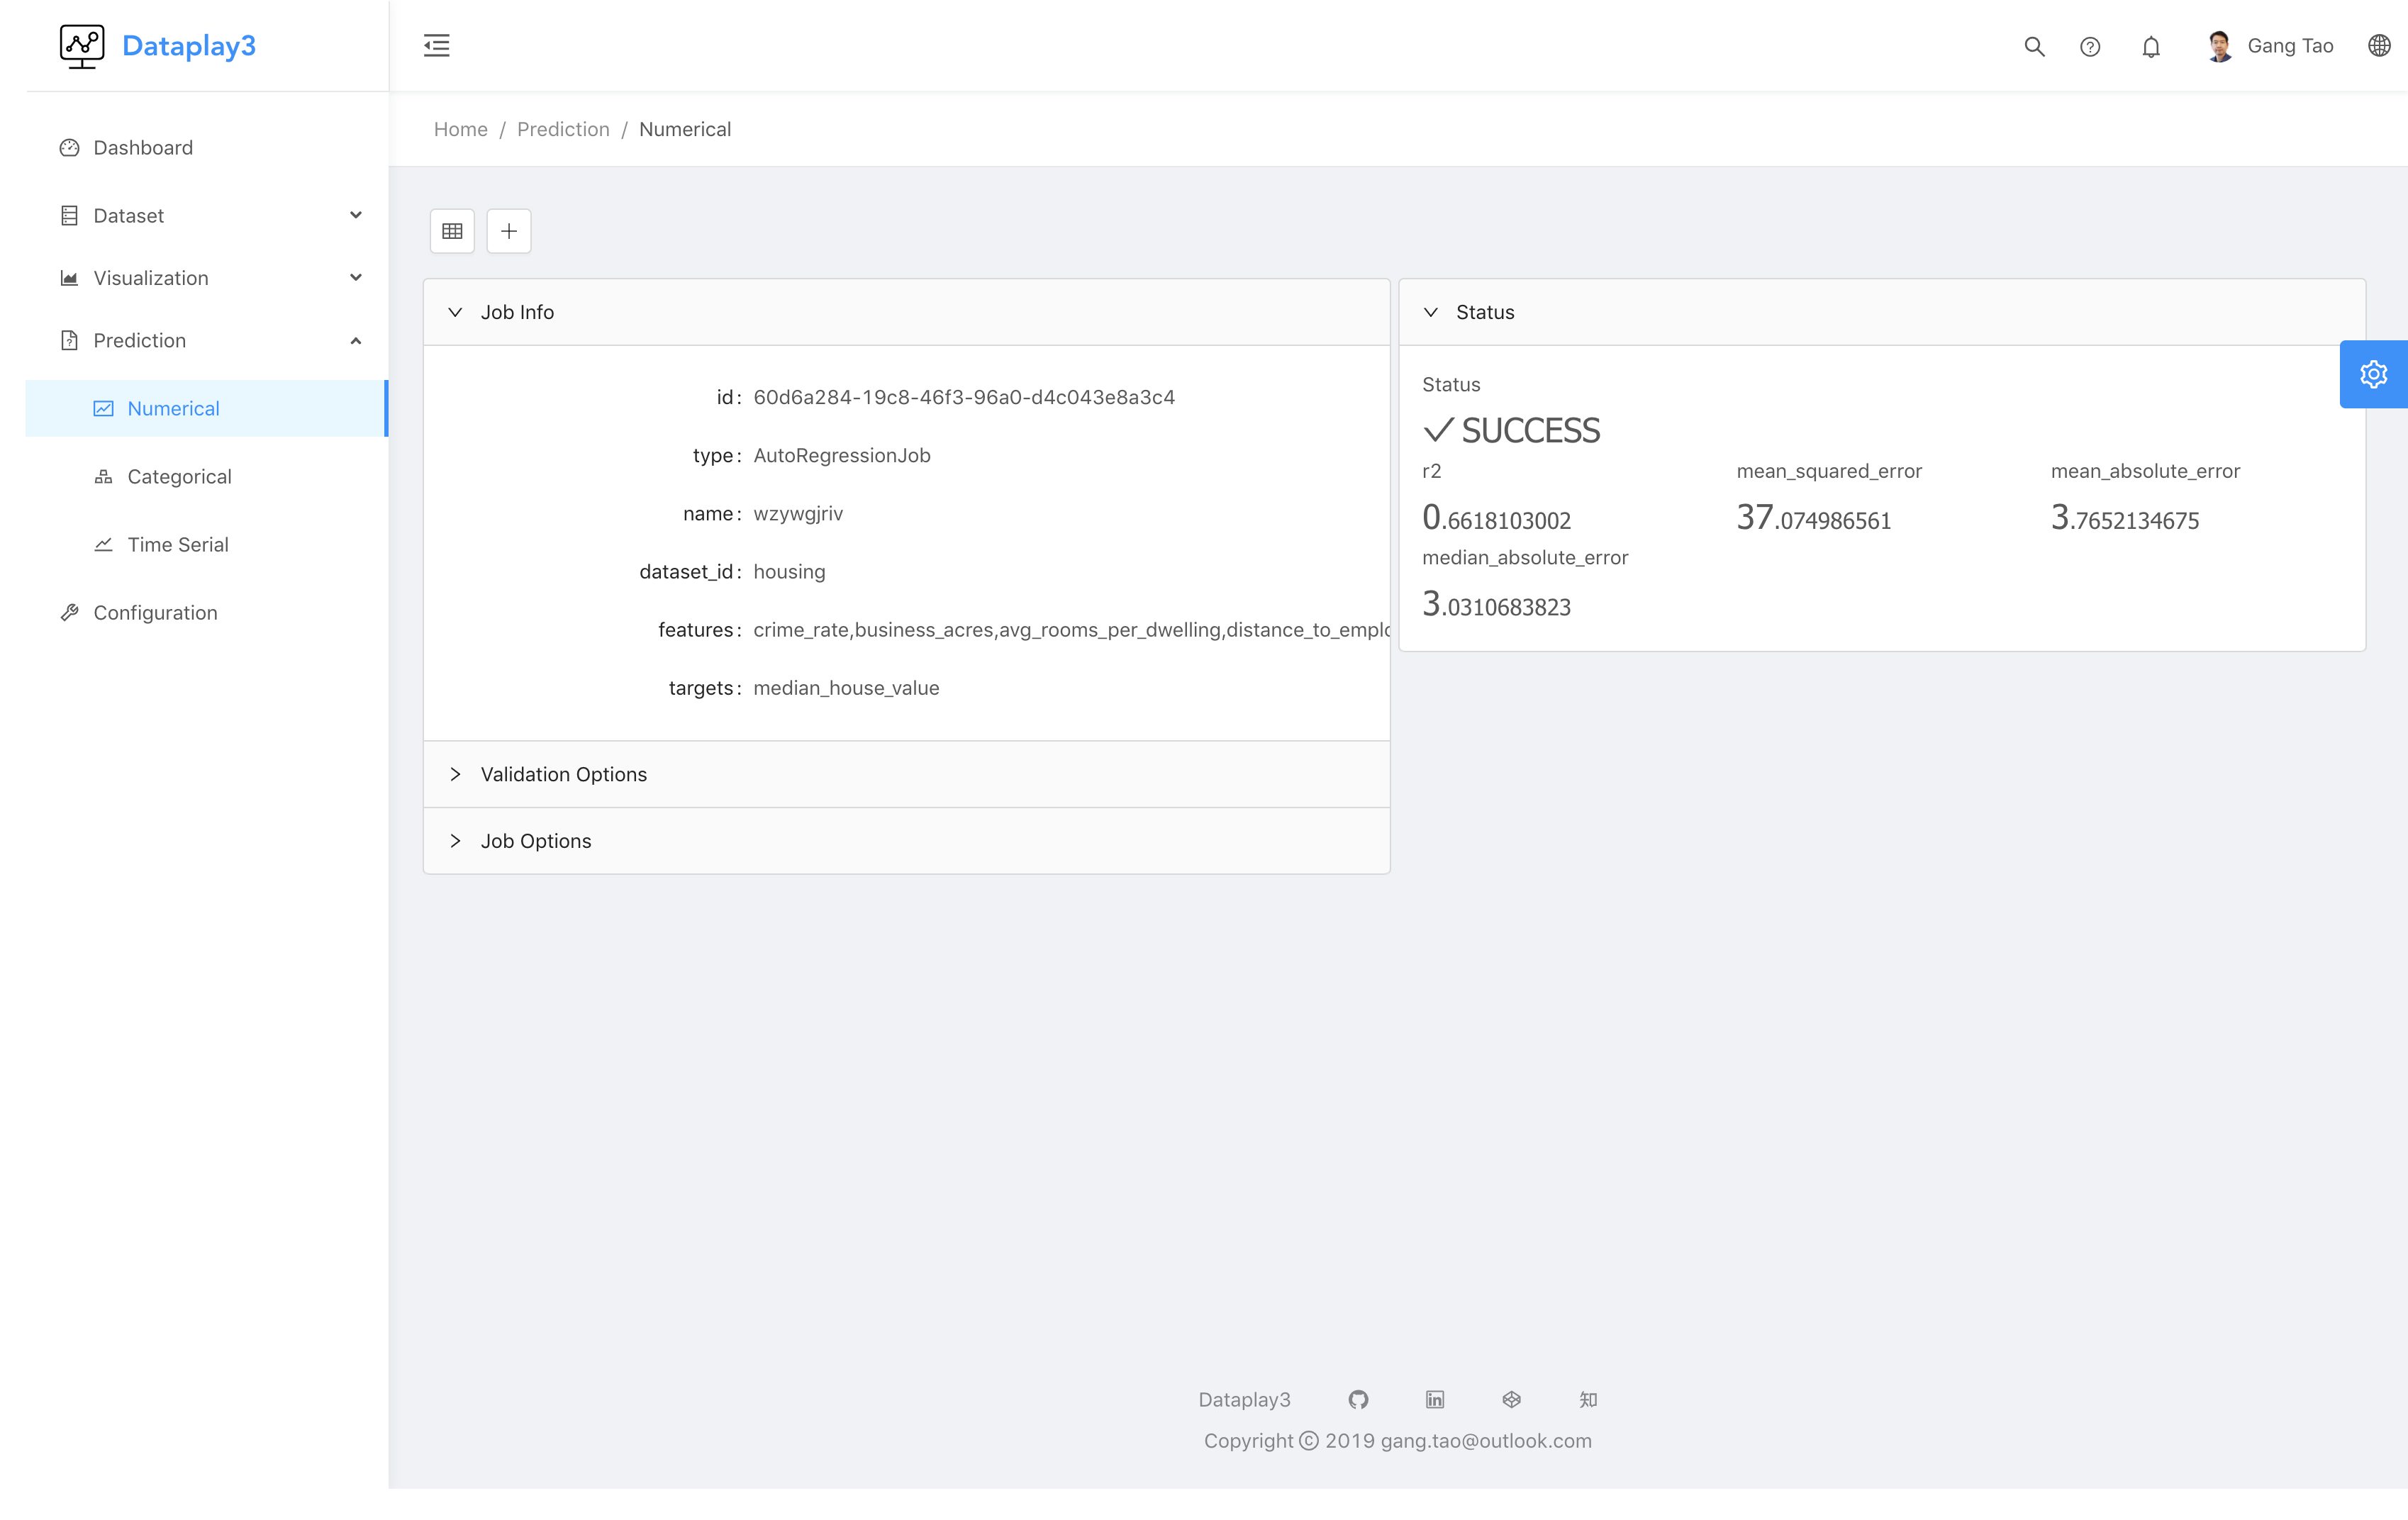
After training completed, the validation result will show on the details page.
For categorical prediction model, you will get accuracy,f1,recall,precision and a chart of confusion matrix
For categorical prediction model, you will get accuracy,f1,recall,precision
For time serial model, you will get prediction trend chart
To use your model, click the predict link in the list view of your model, select a dataset and check what the prediction result
Deploy the mode is not implemented yet.
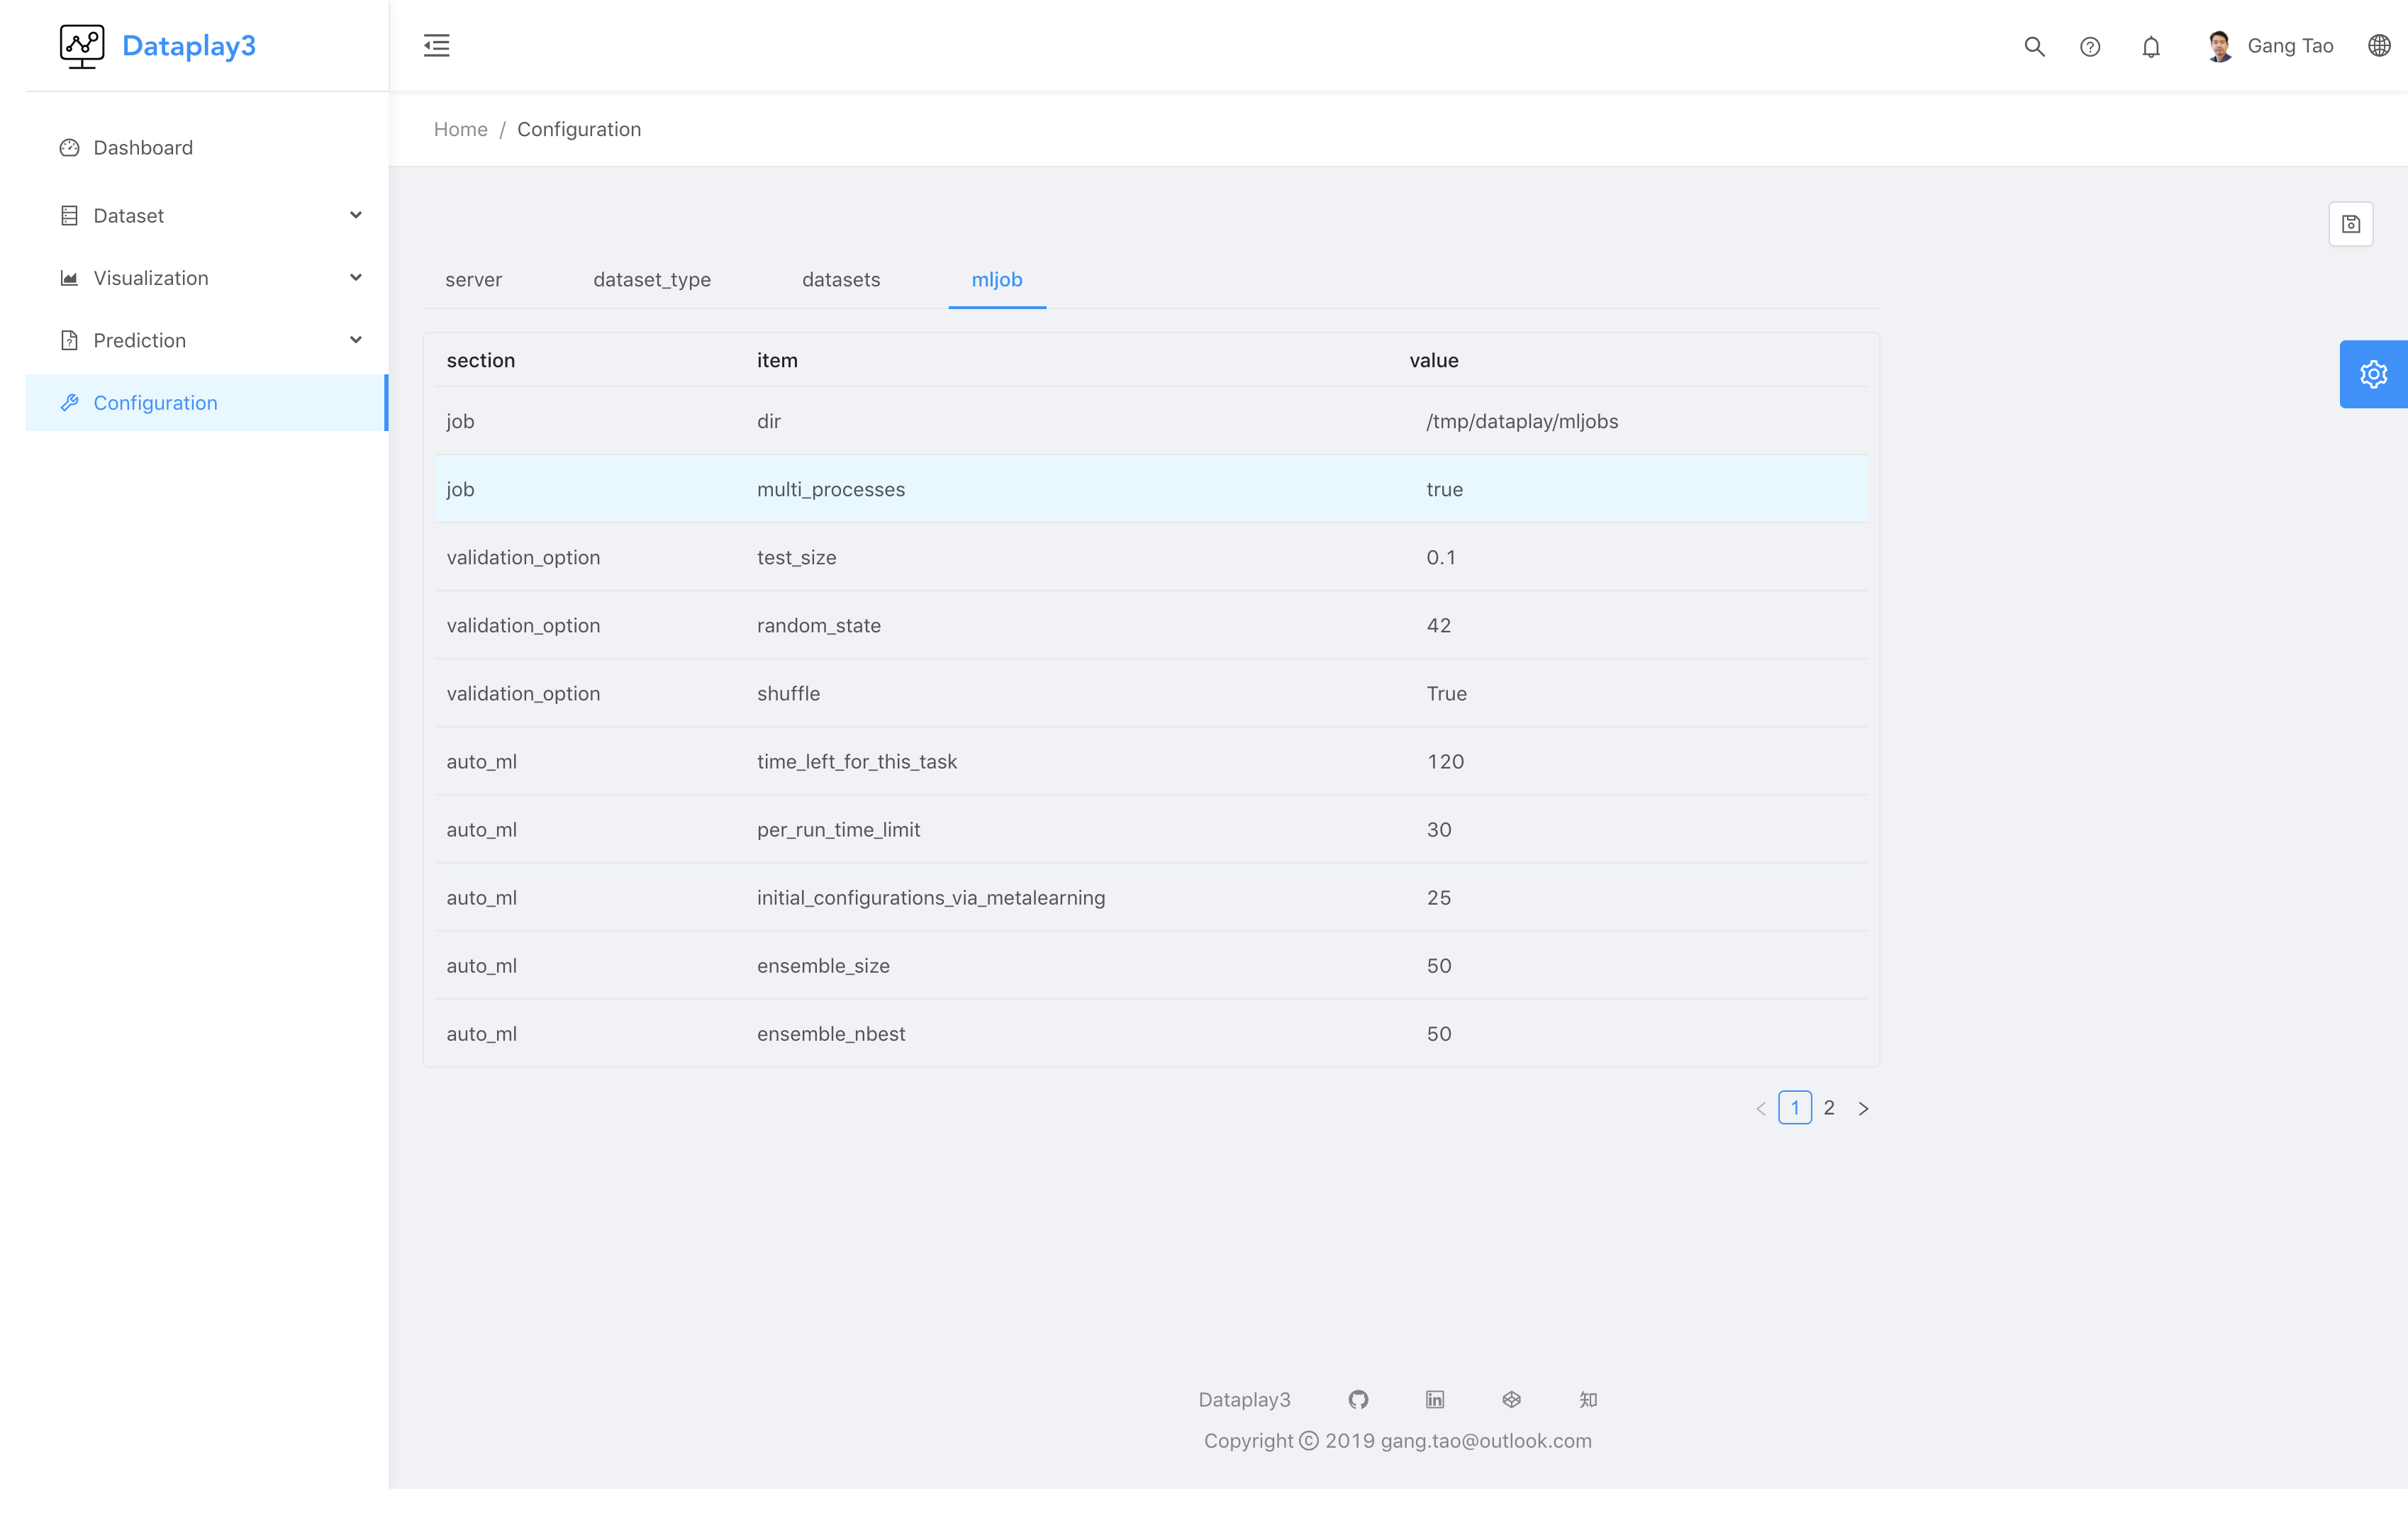
configurations
You can manage server side configuration through configuration